COVID-19 Data Hub
Coronavirus Dashboard Data Hub
We’ve created a public Coronavirus Data Hub based on trusted data sources (e.g. Johns Hopkins University, CDC, W.H.O.) that we are continually updating.
Here are some of the features to explore in the Coronavirus Data Hub:
Dashboards
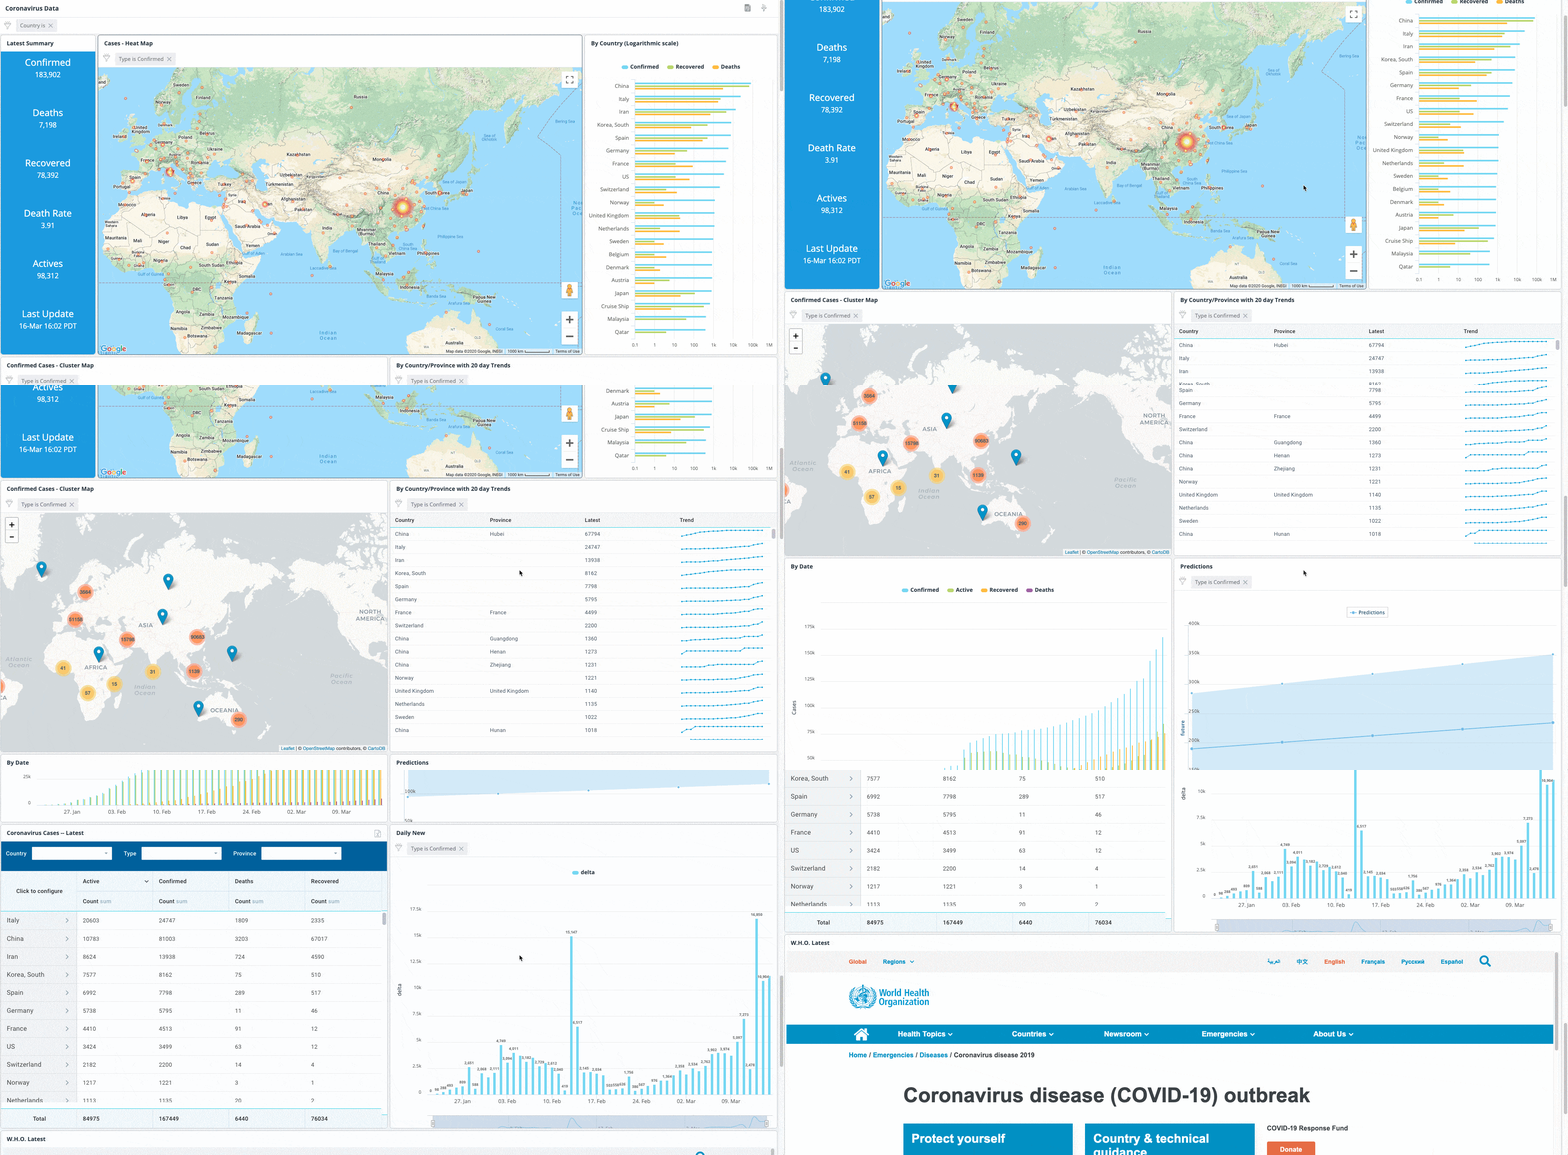
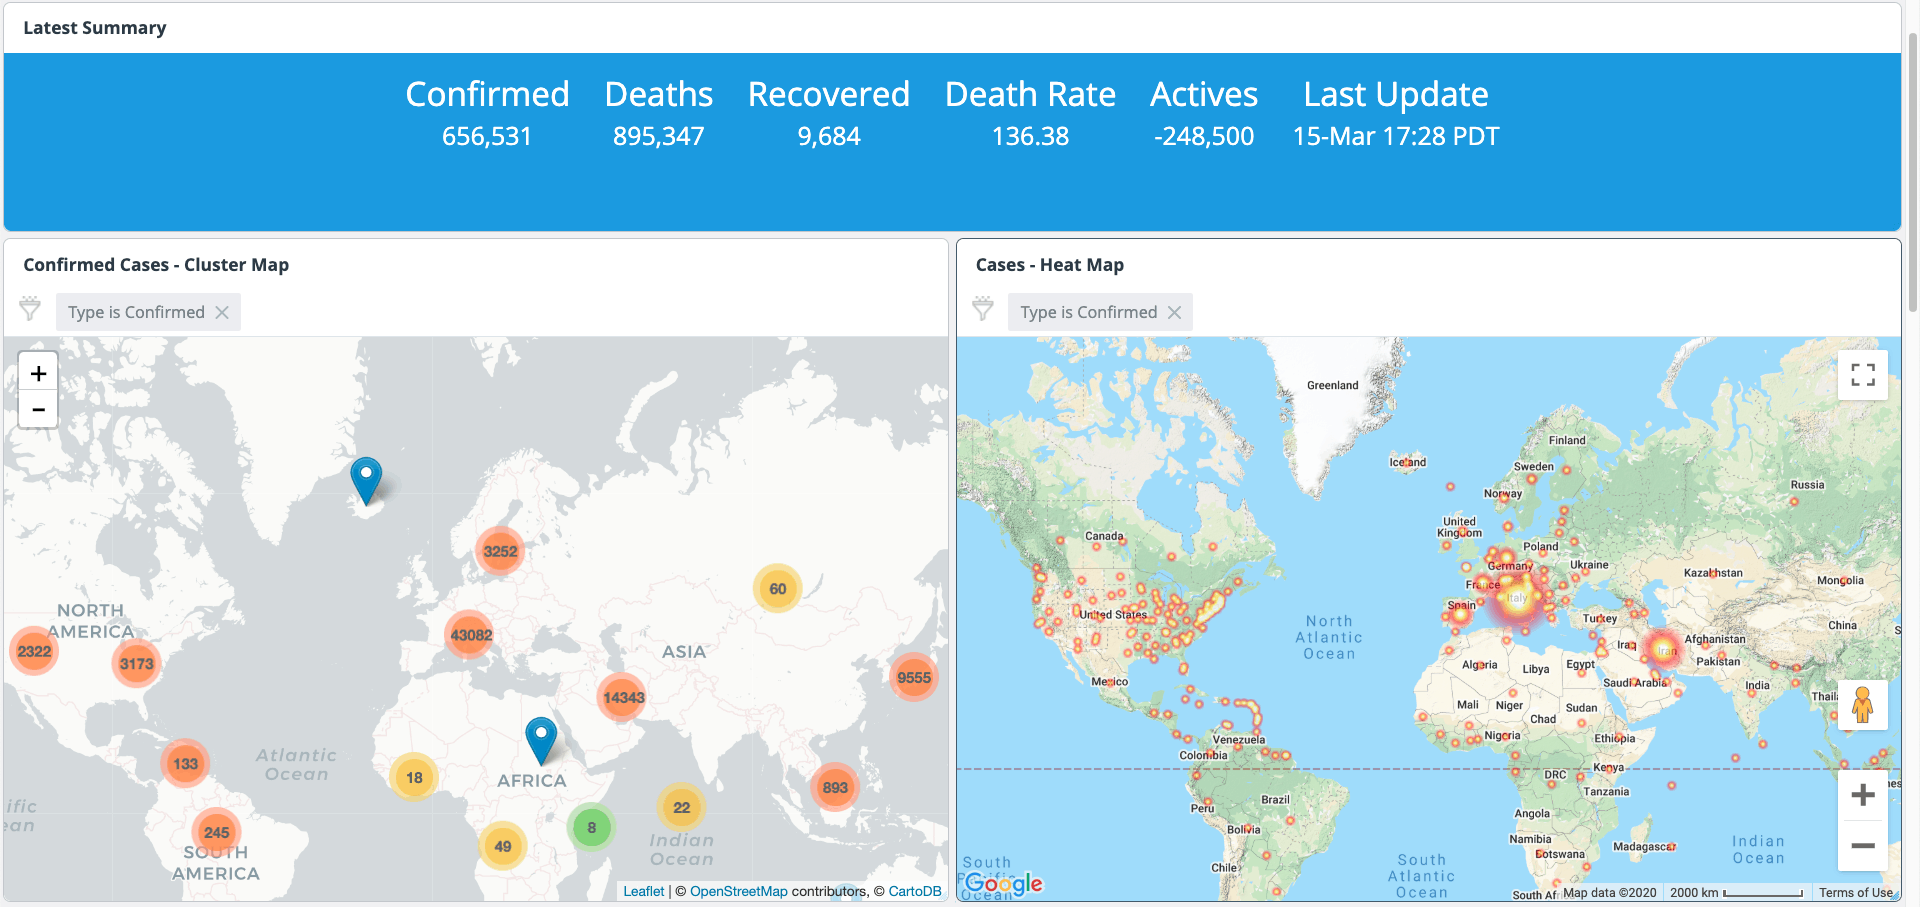
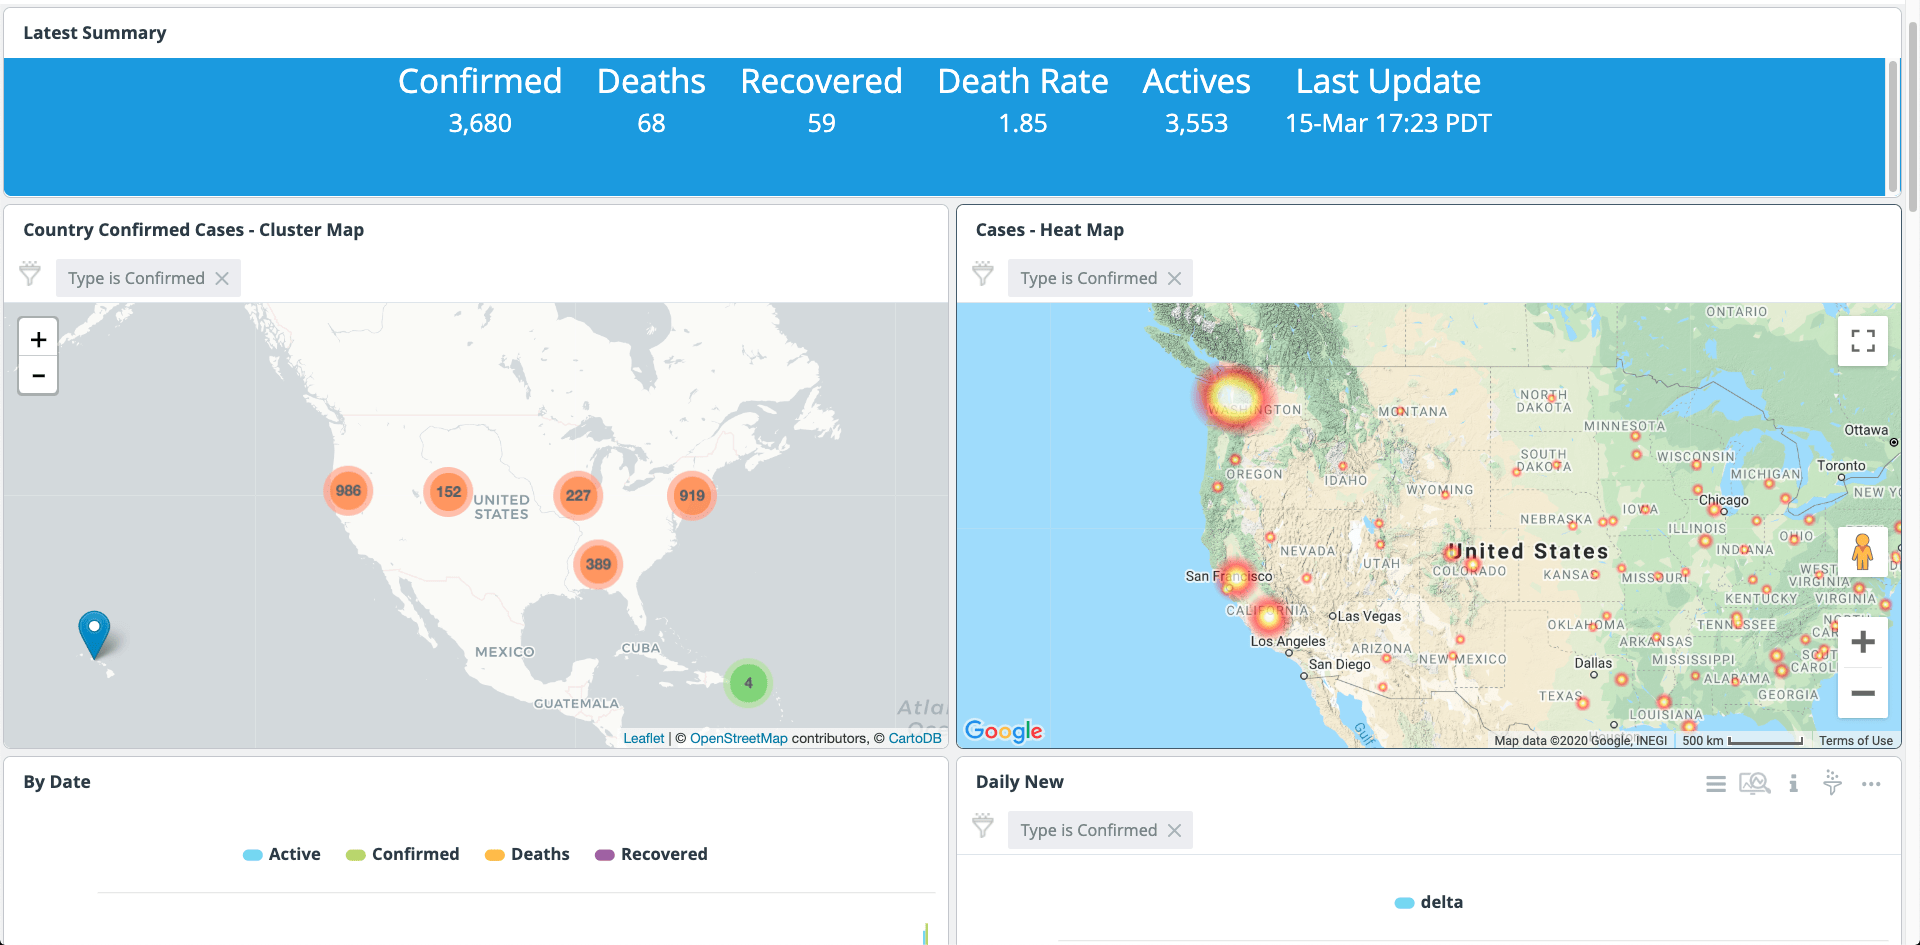
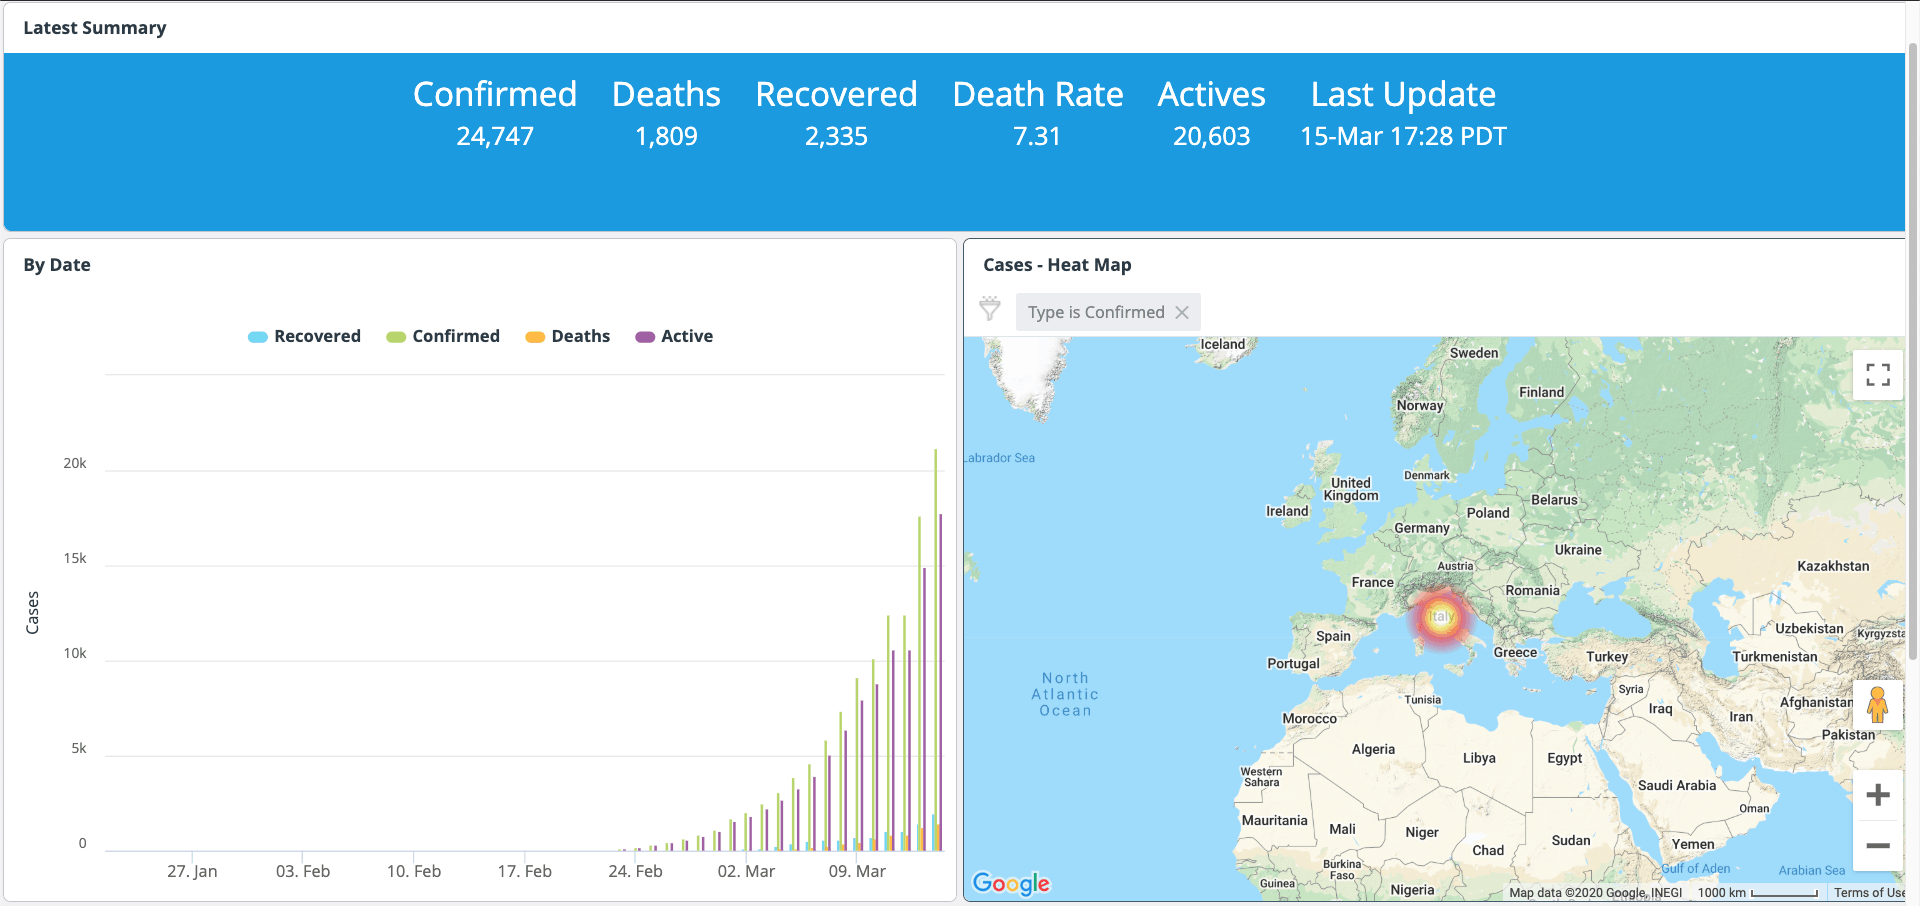
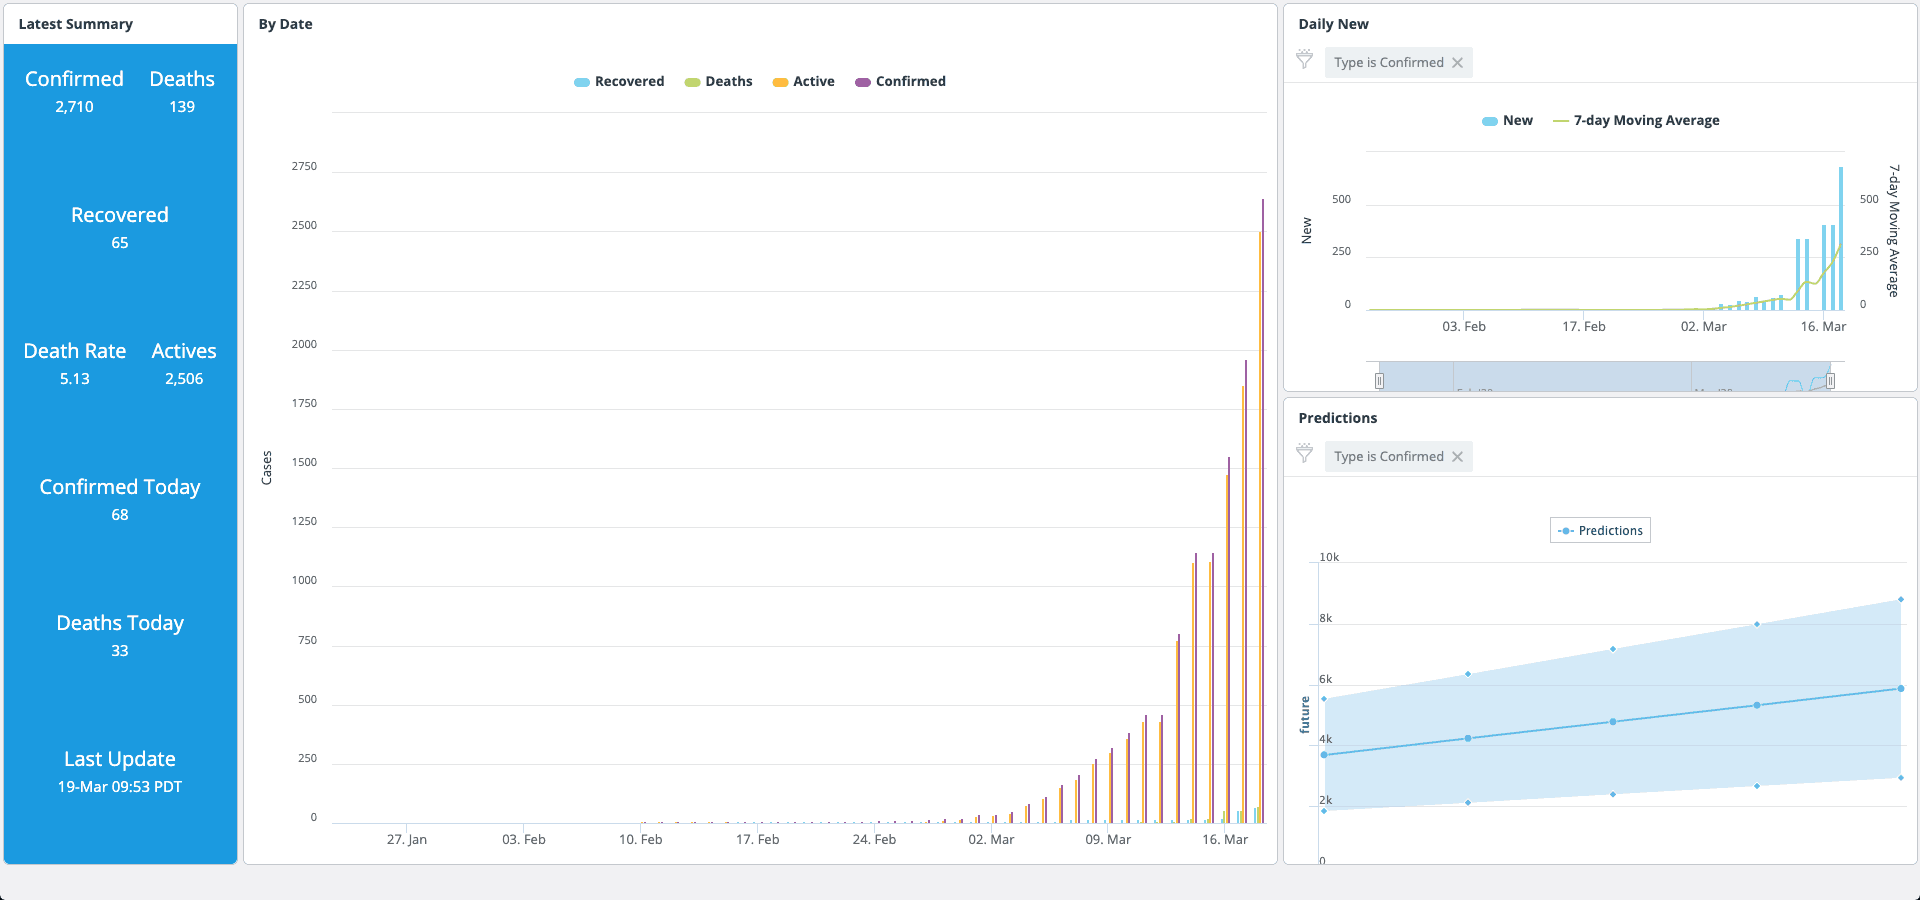
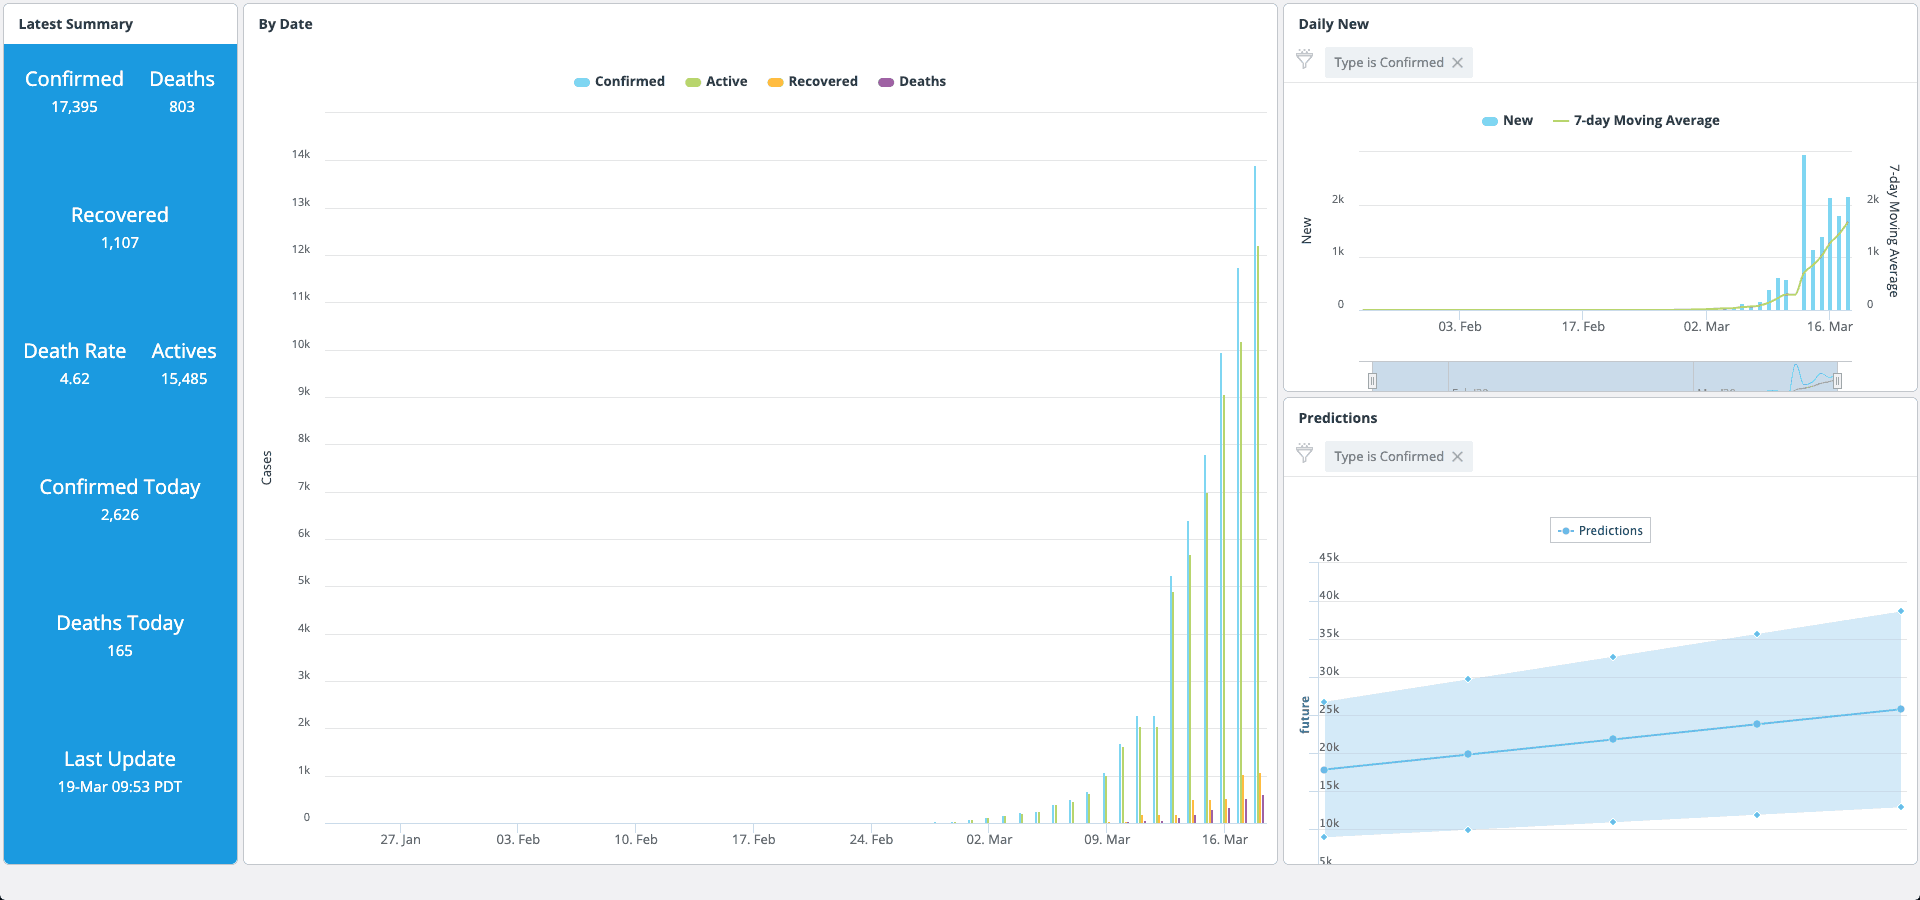
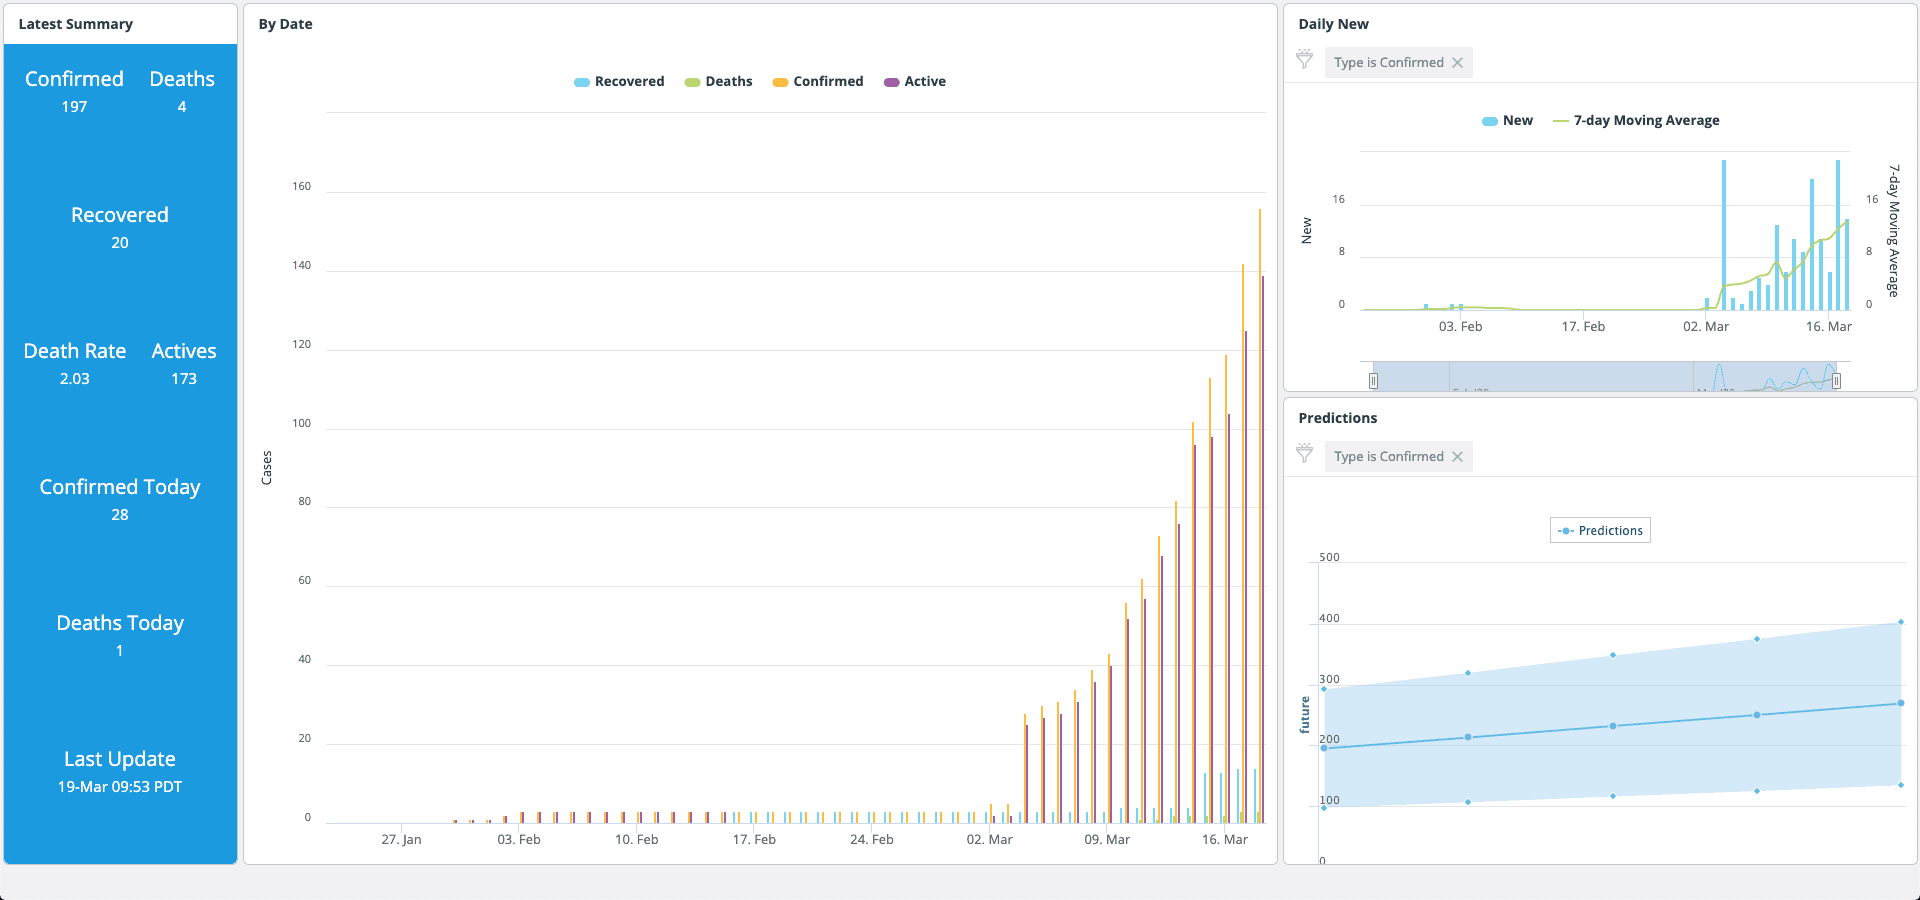
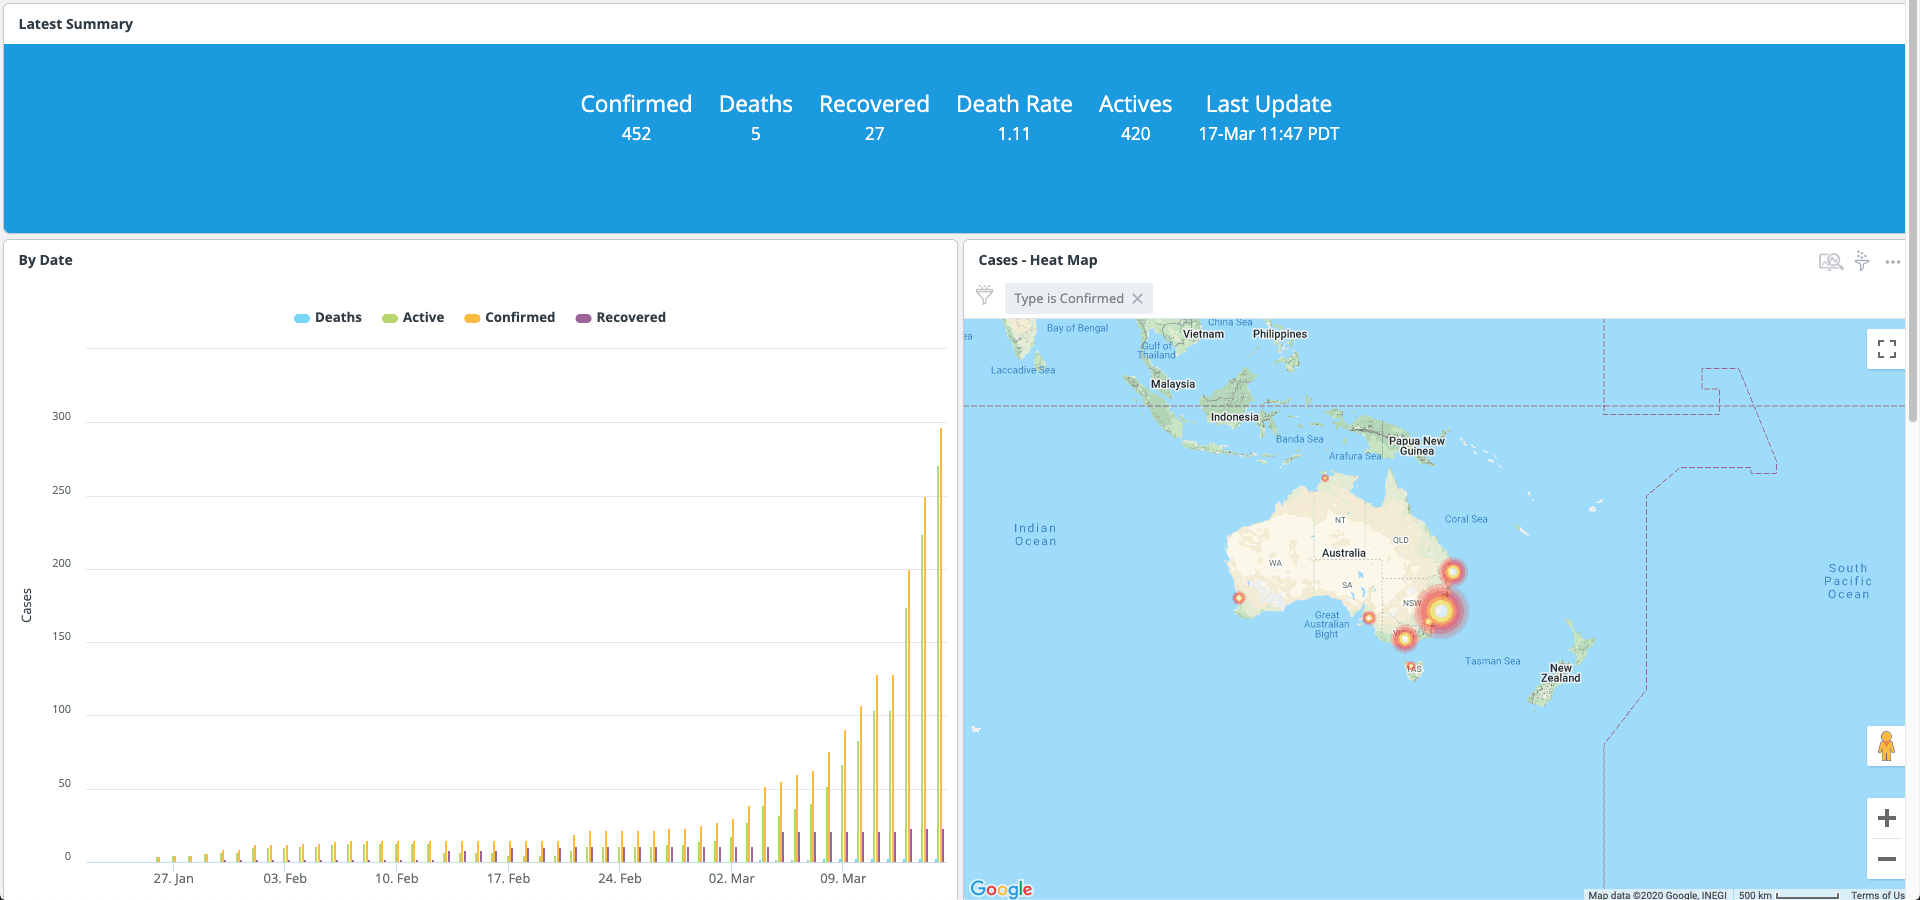
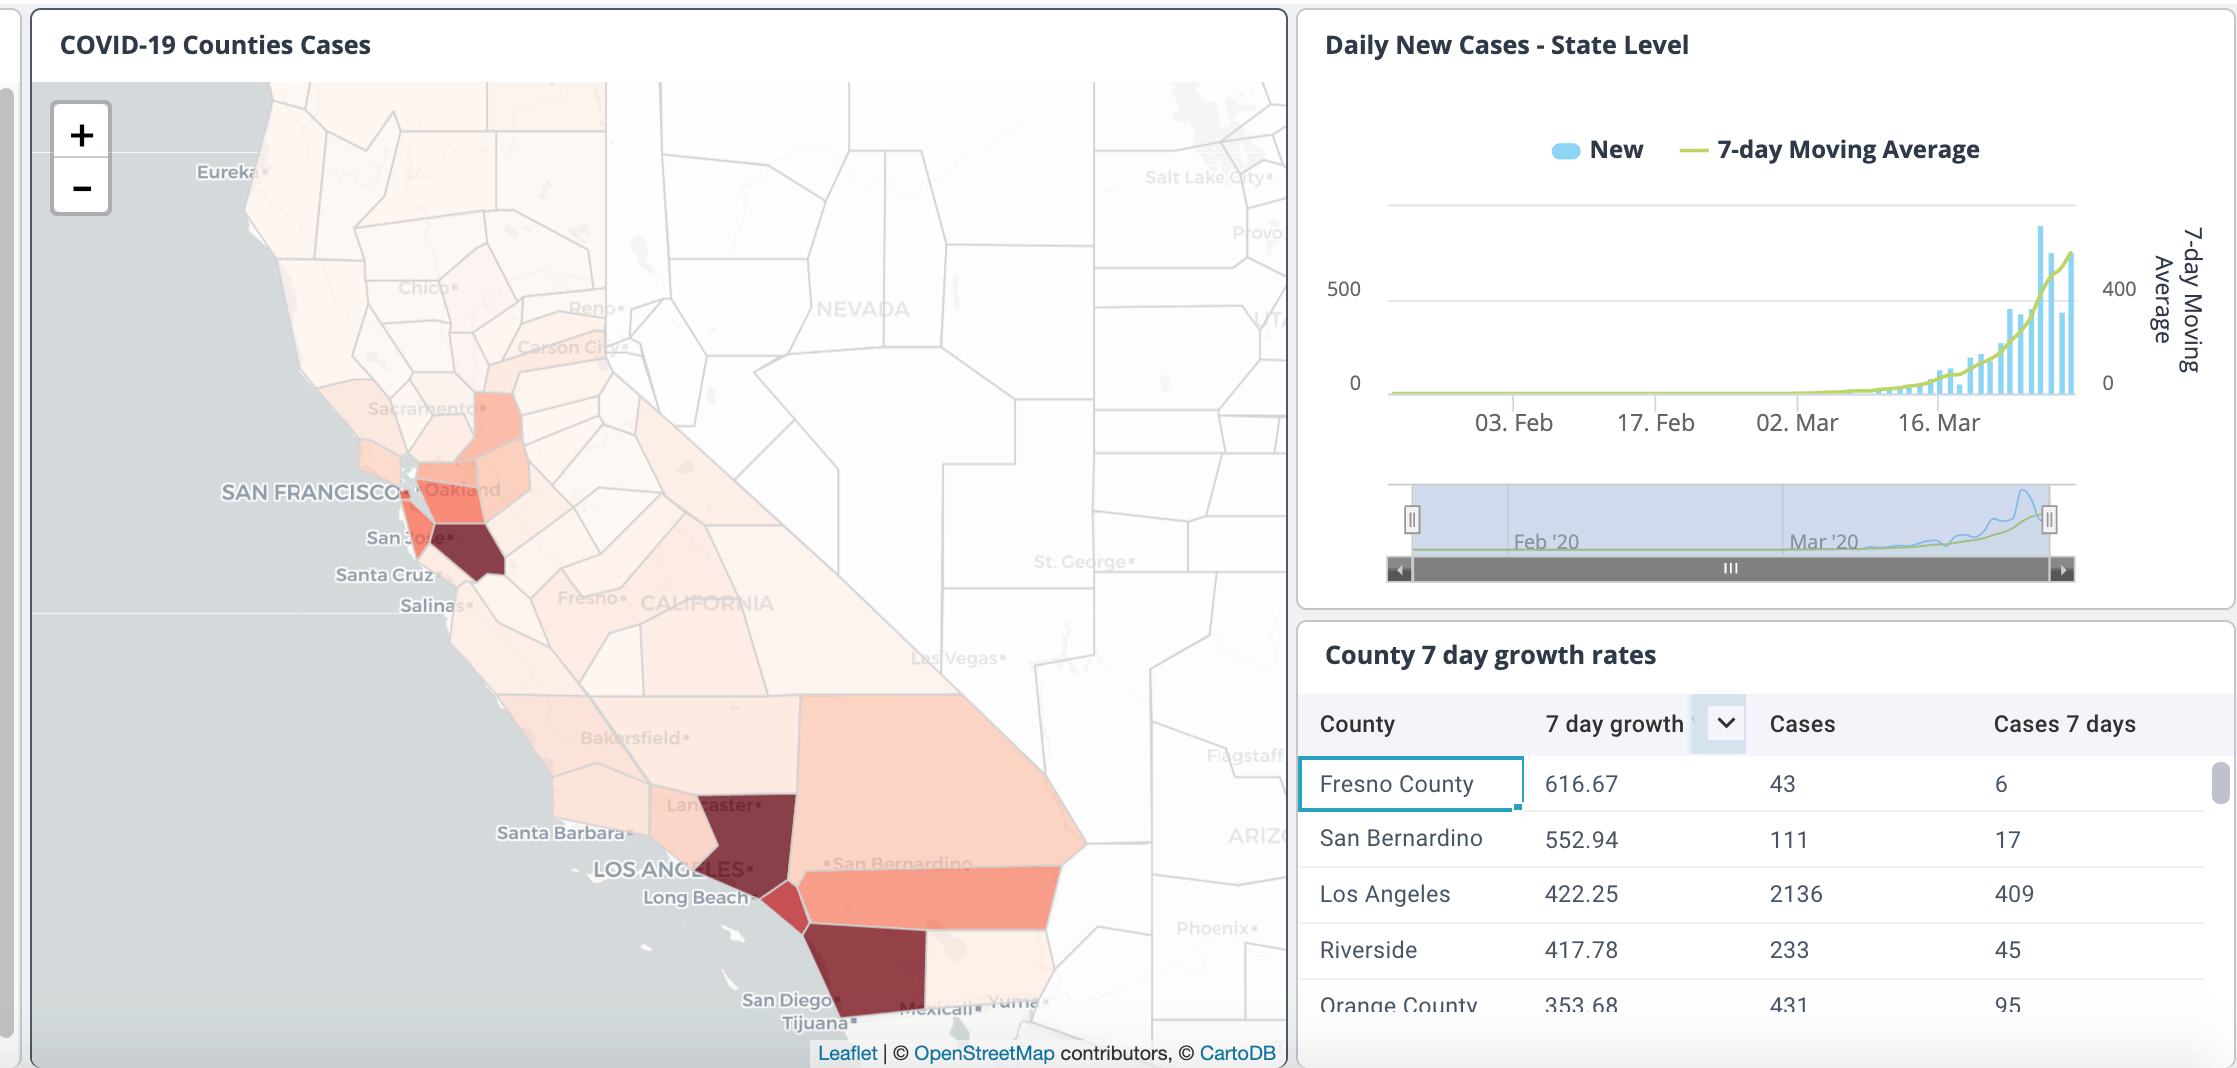
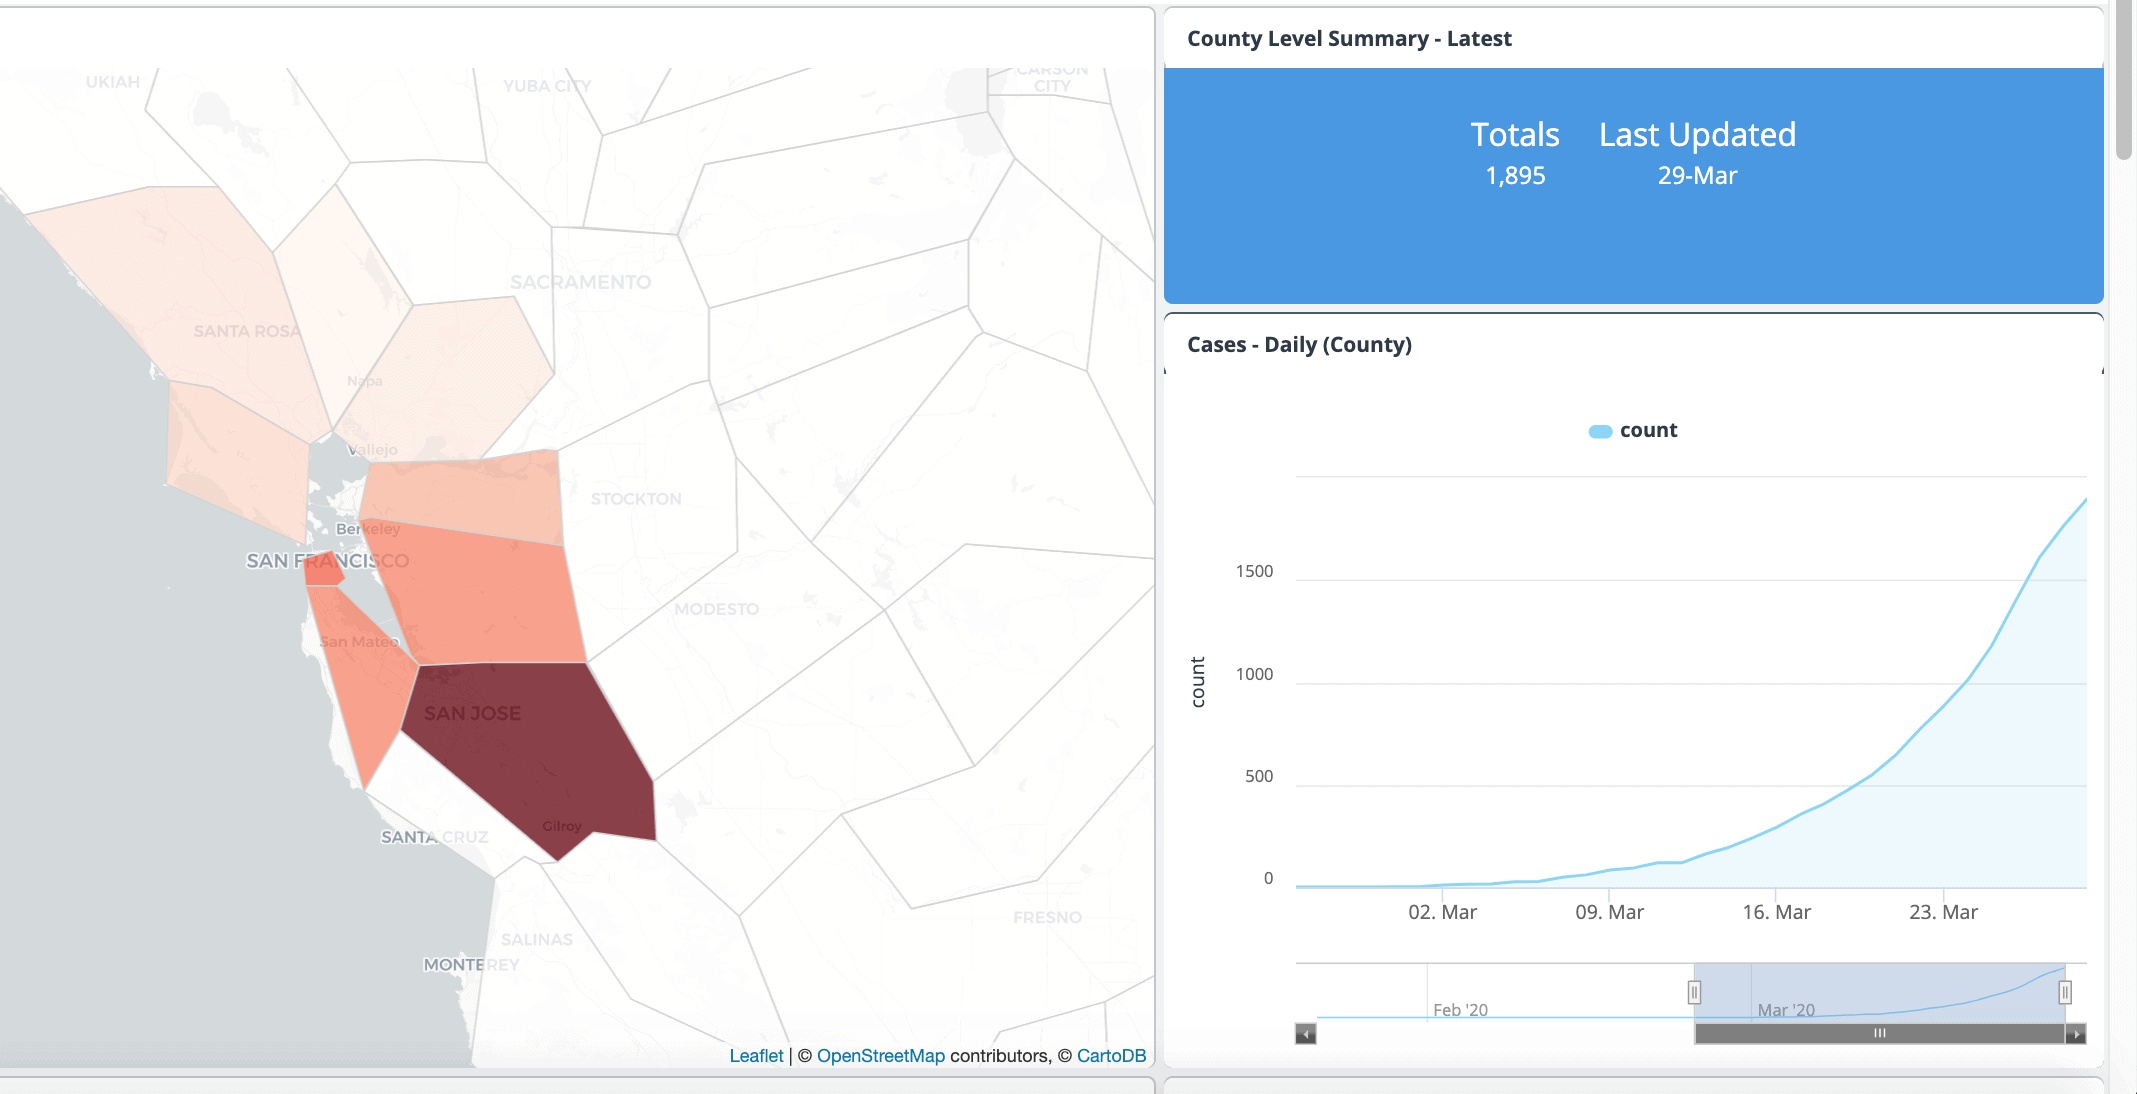
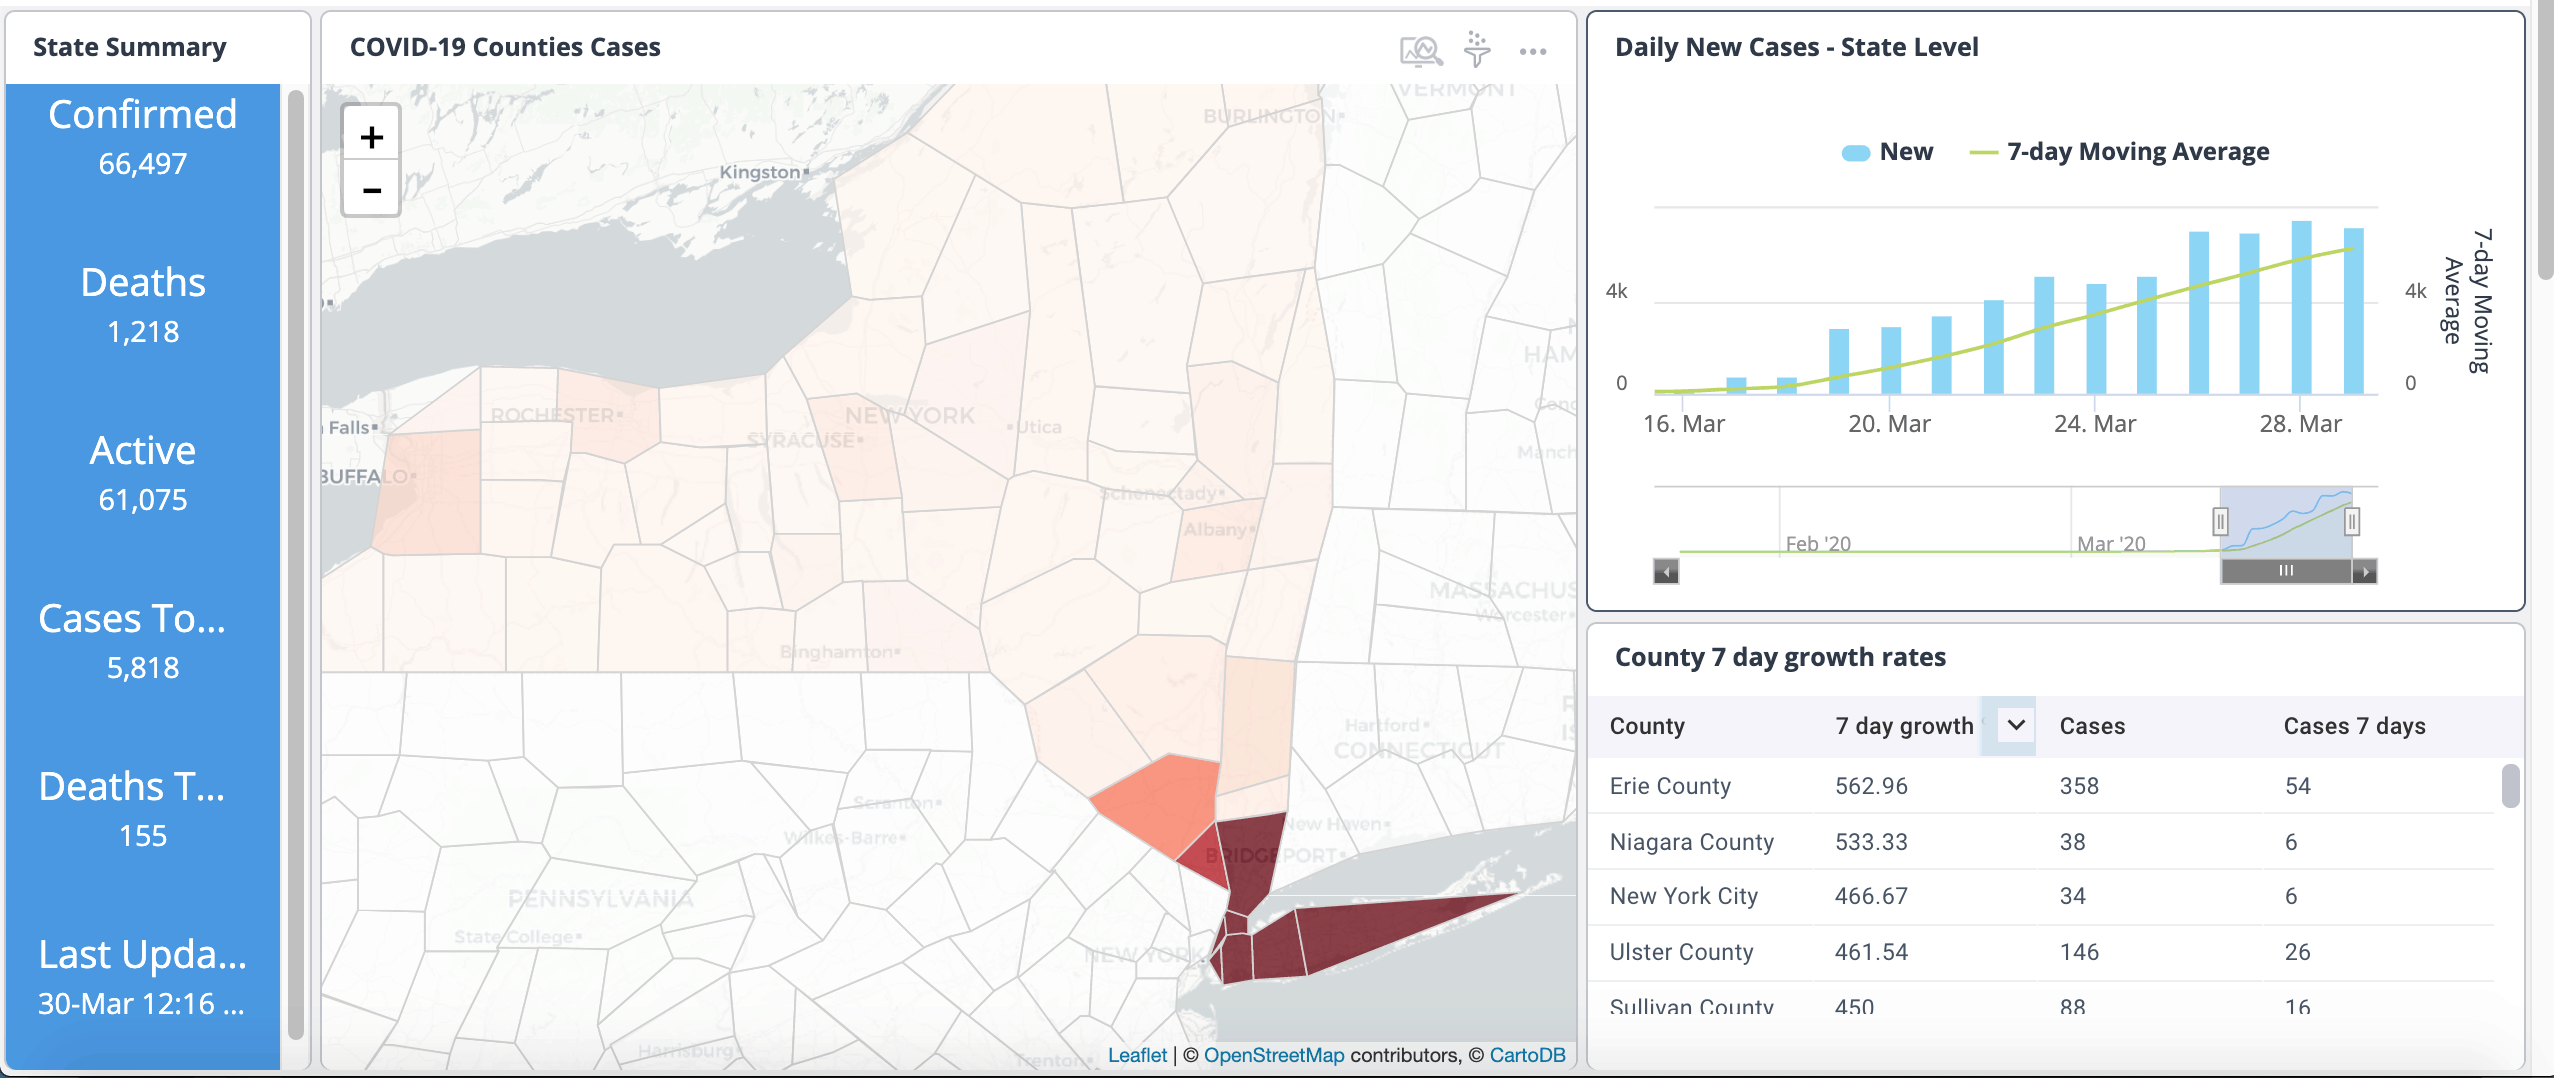
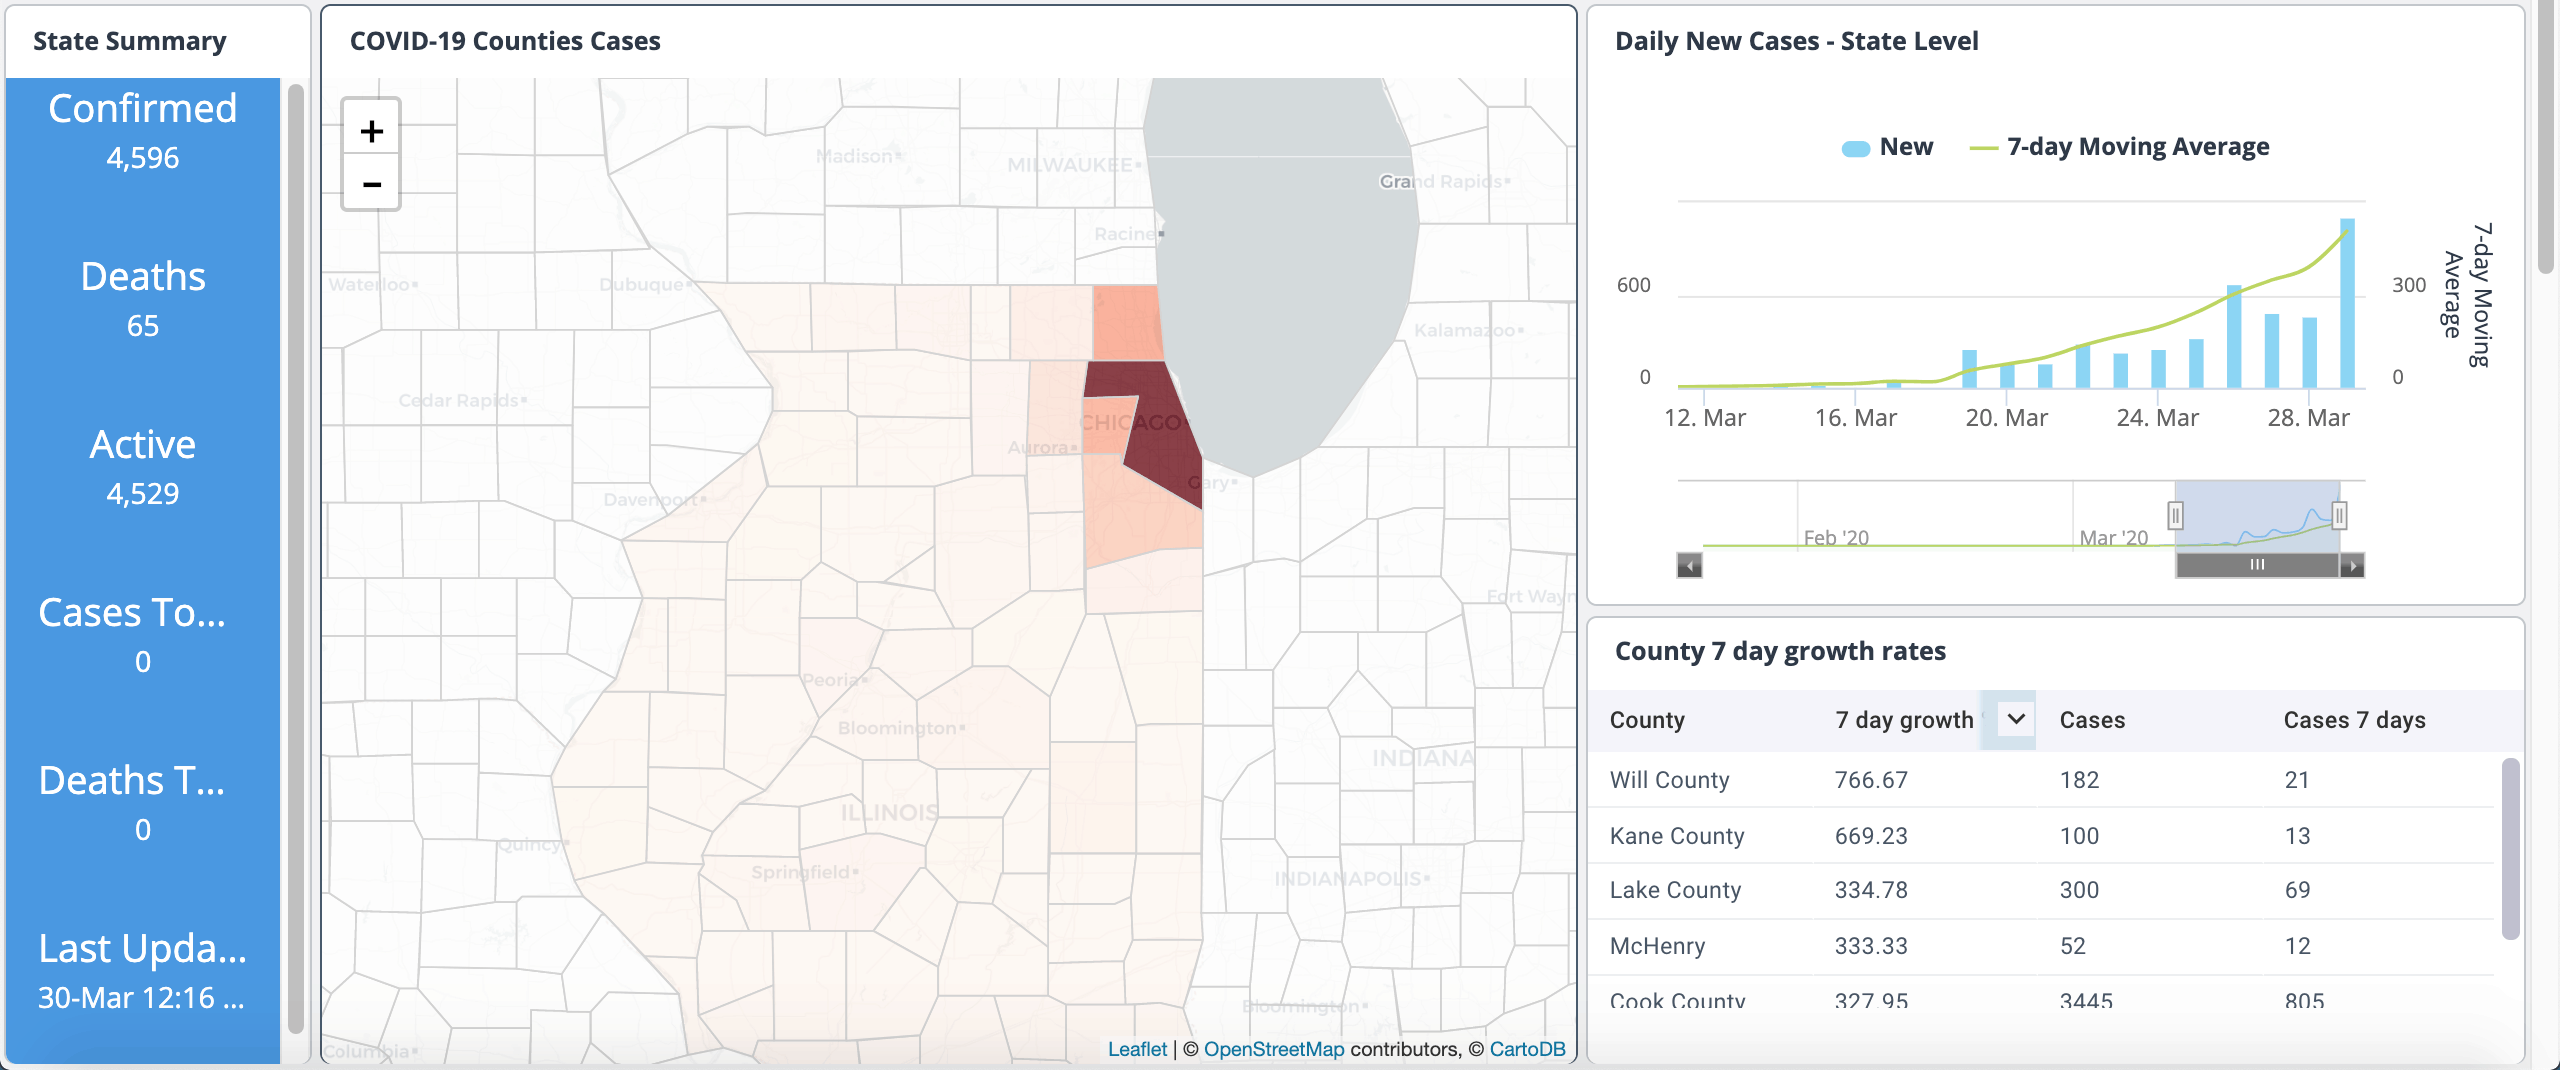
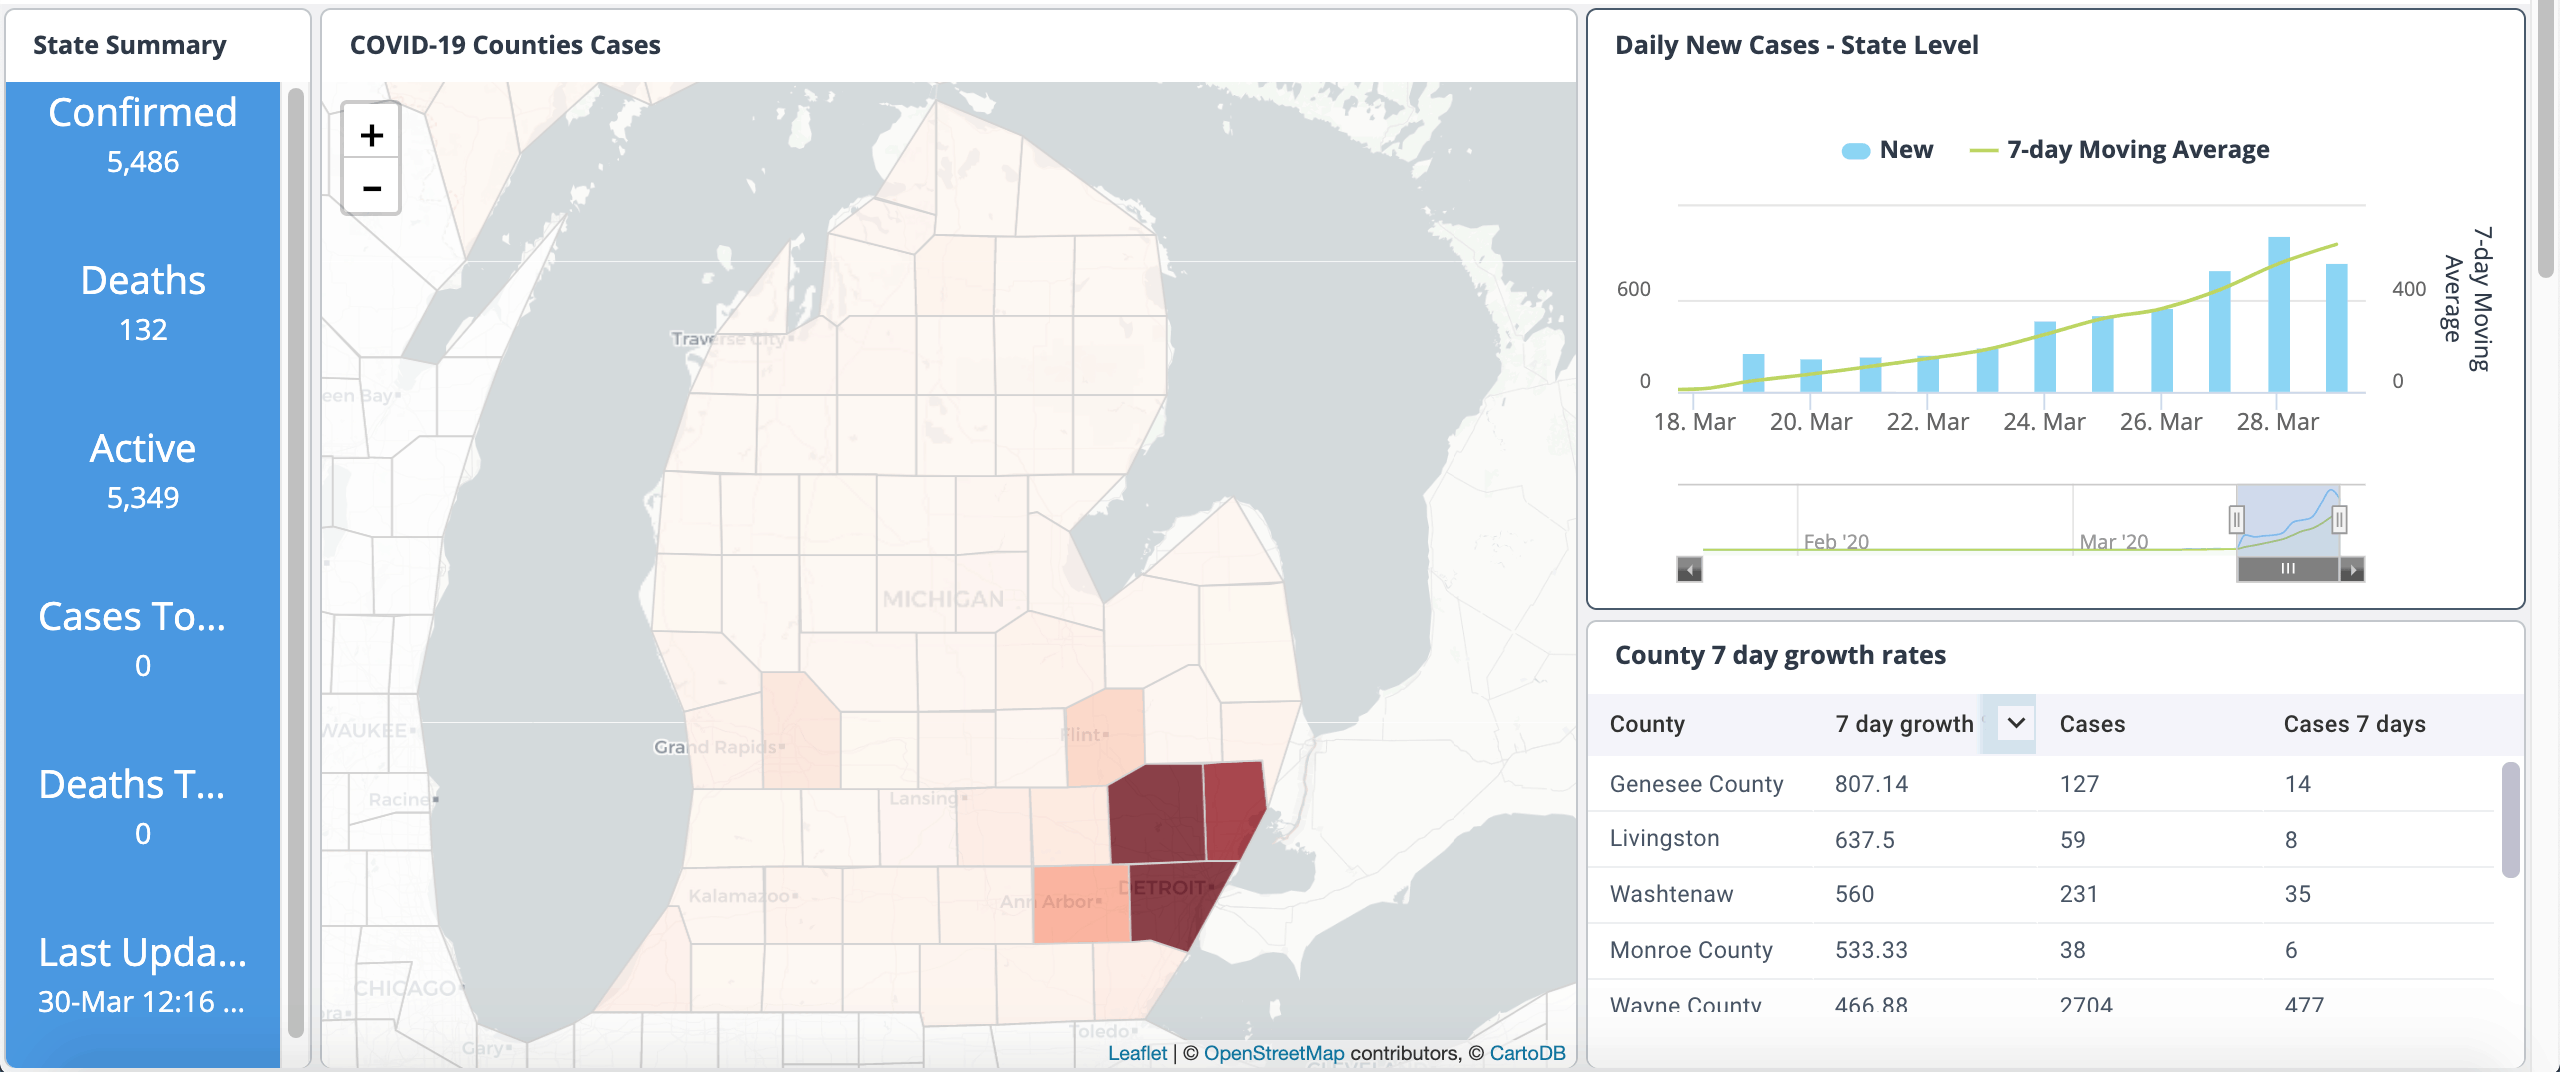
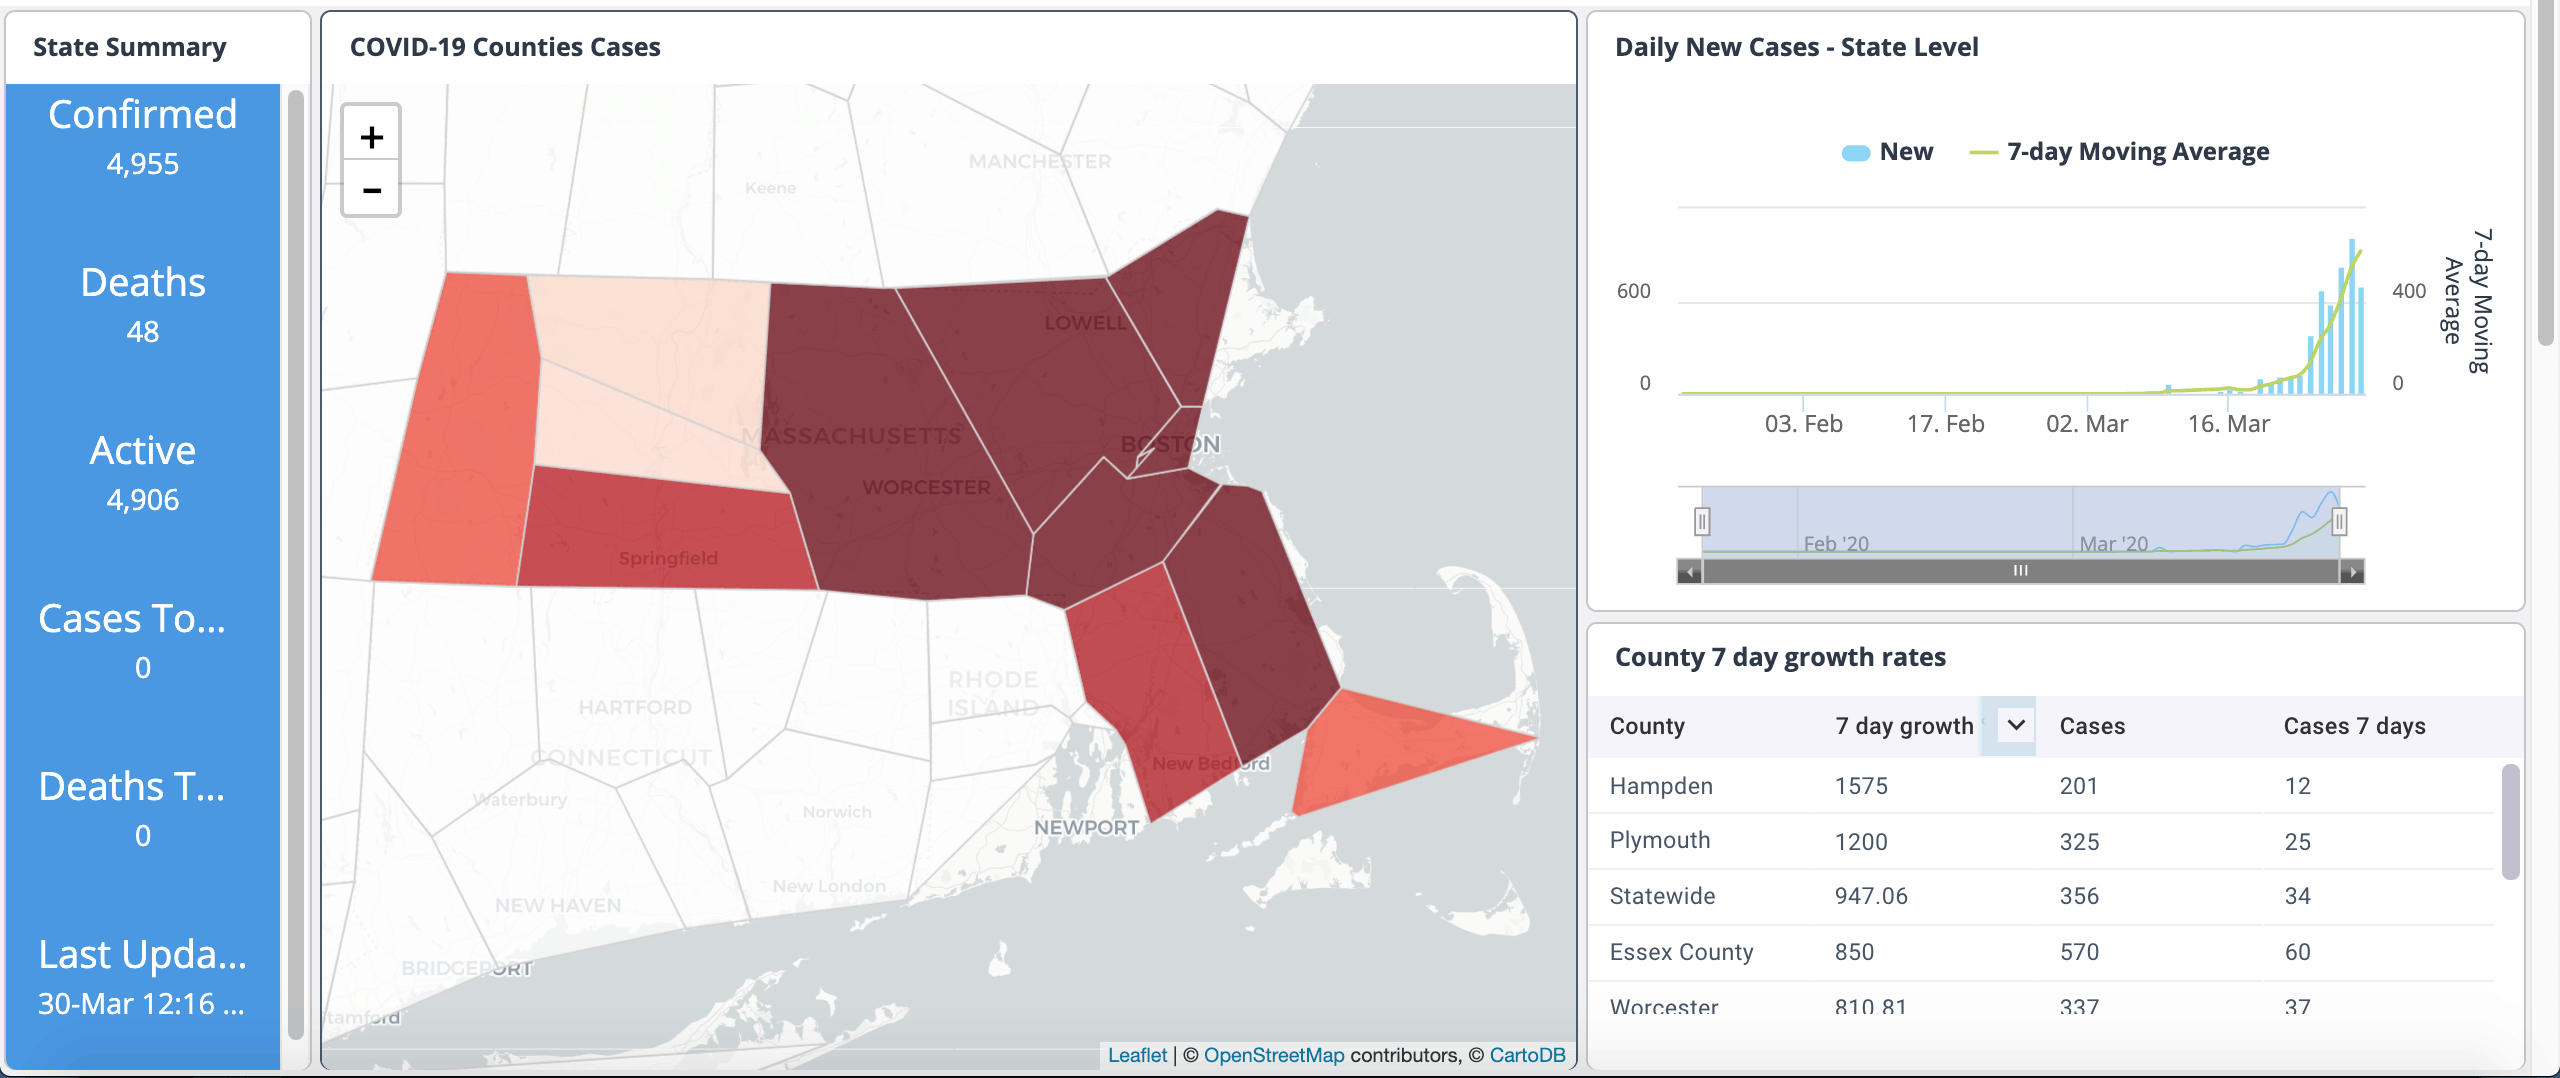
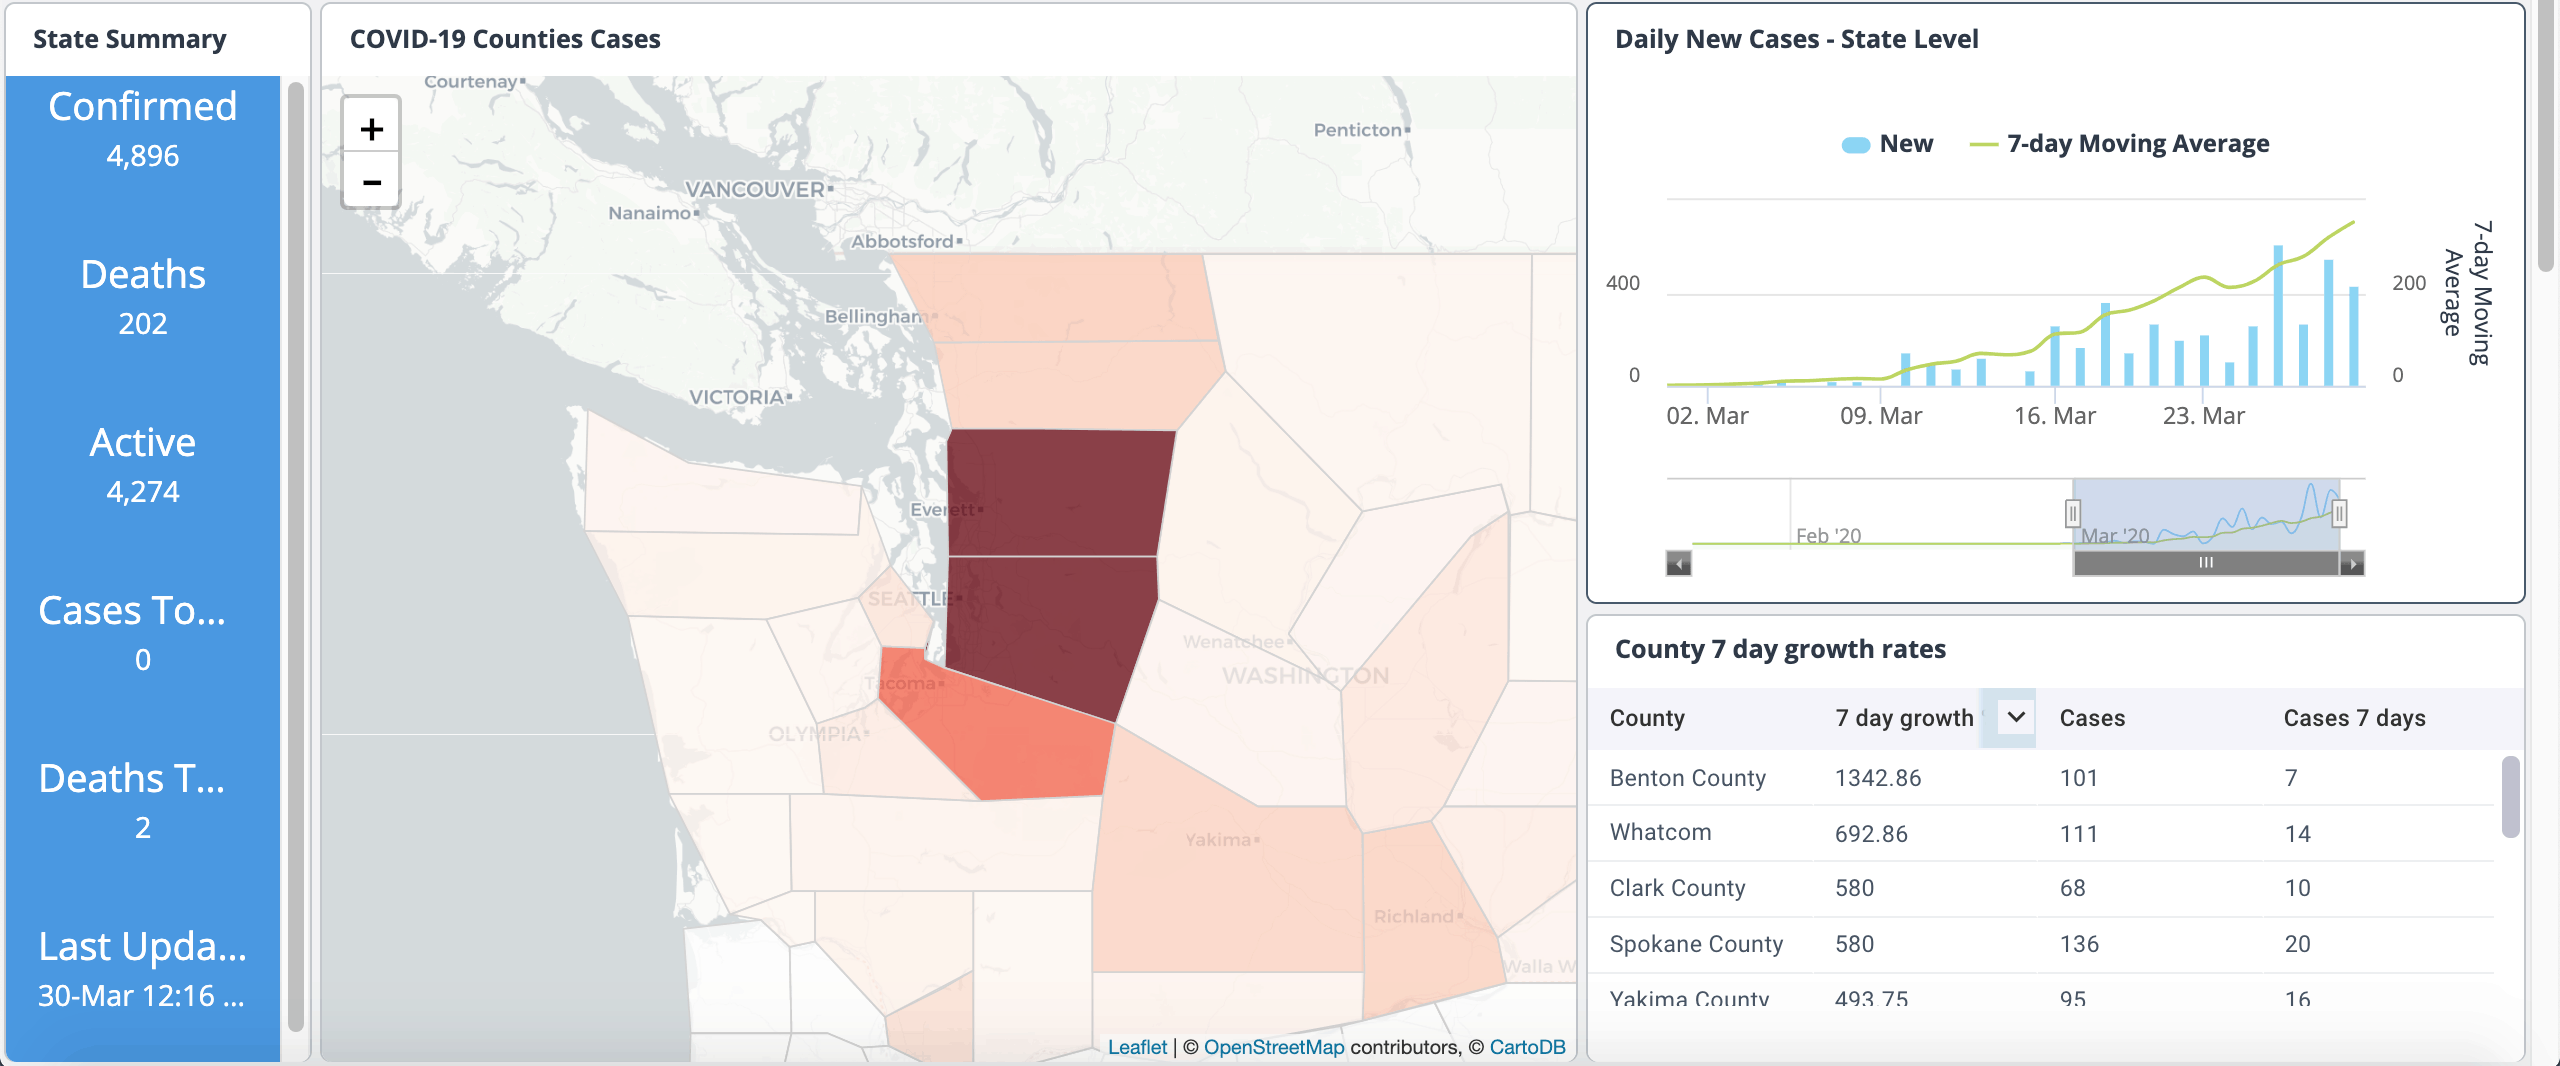
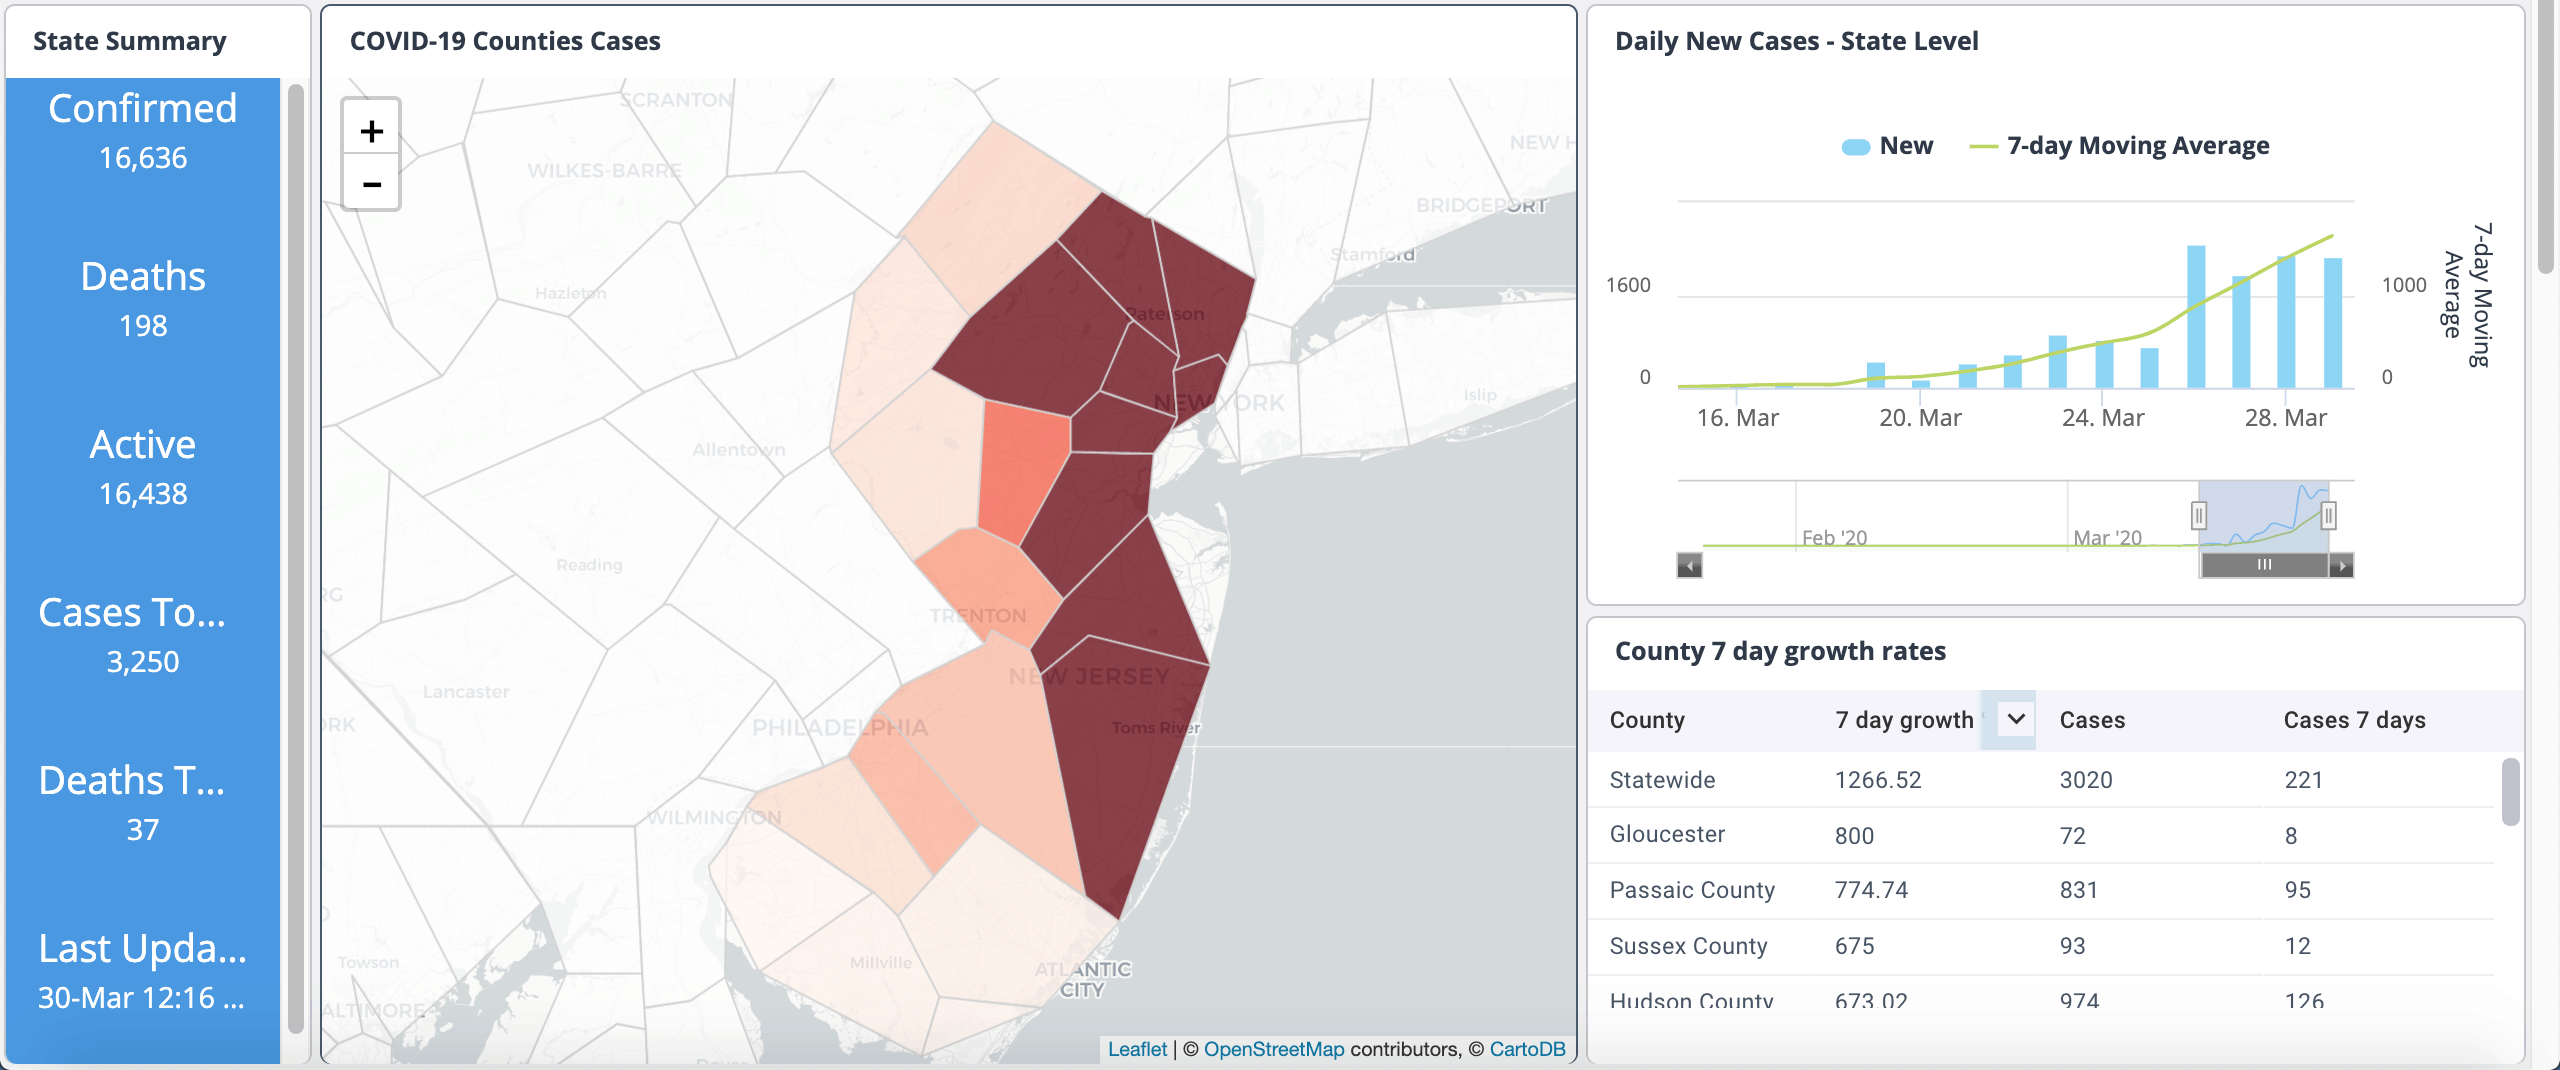
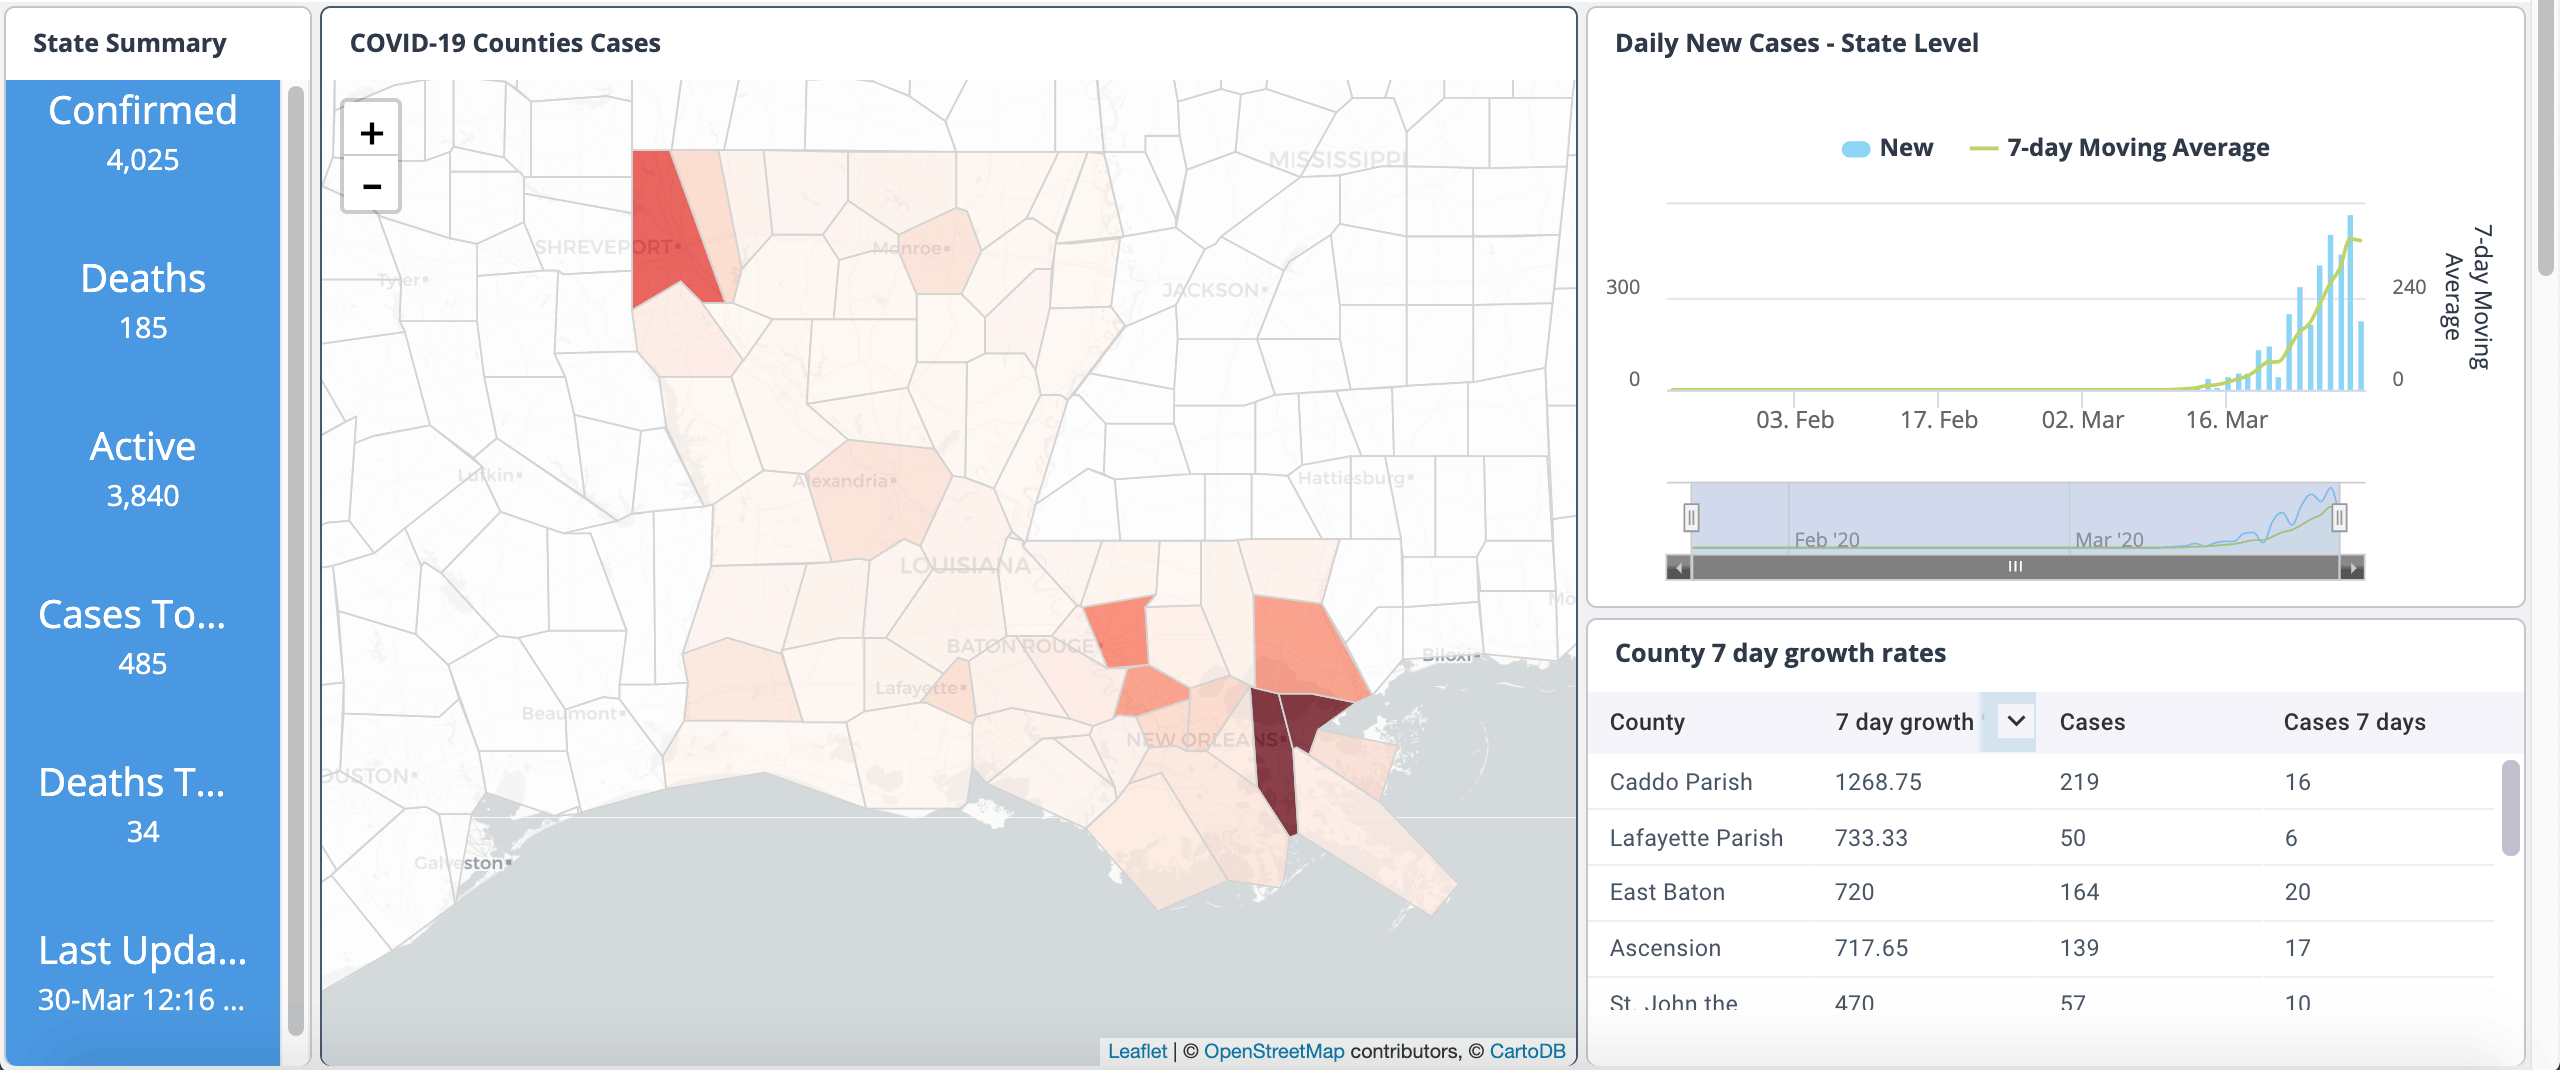
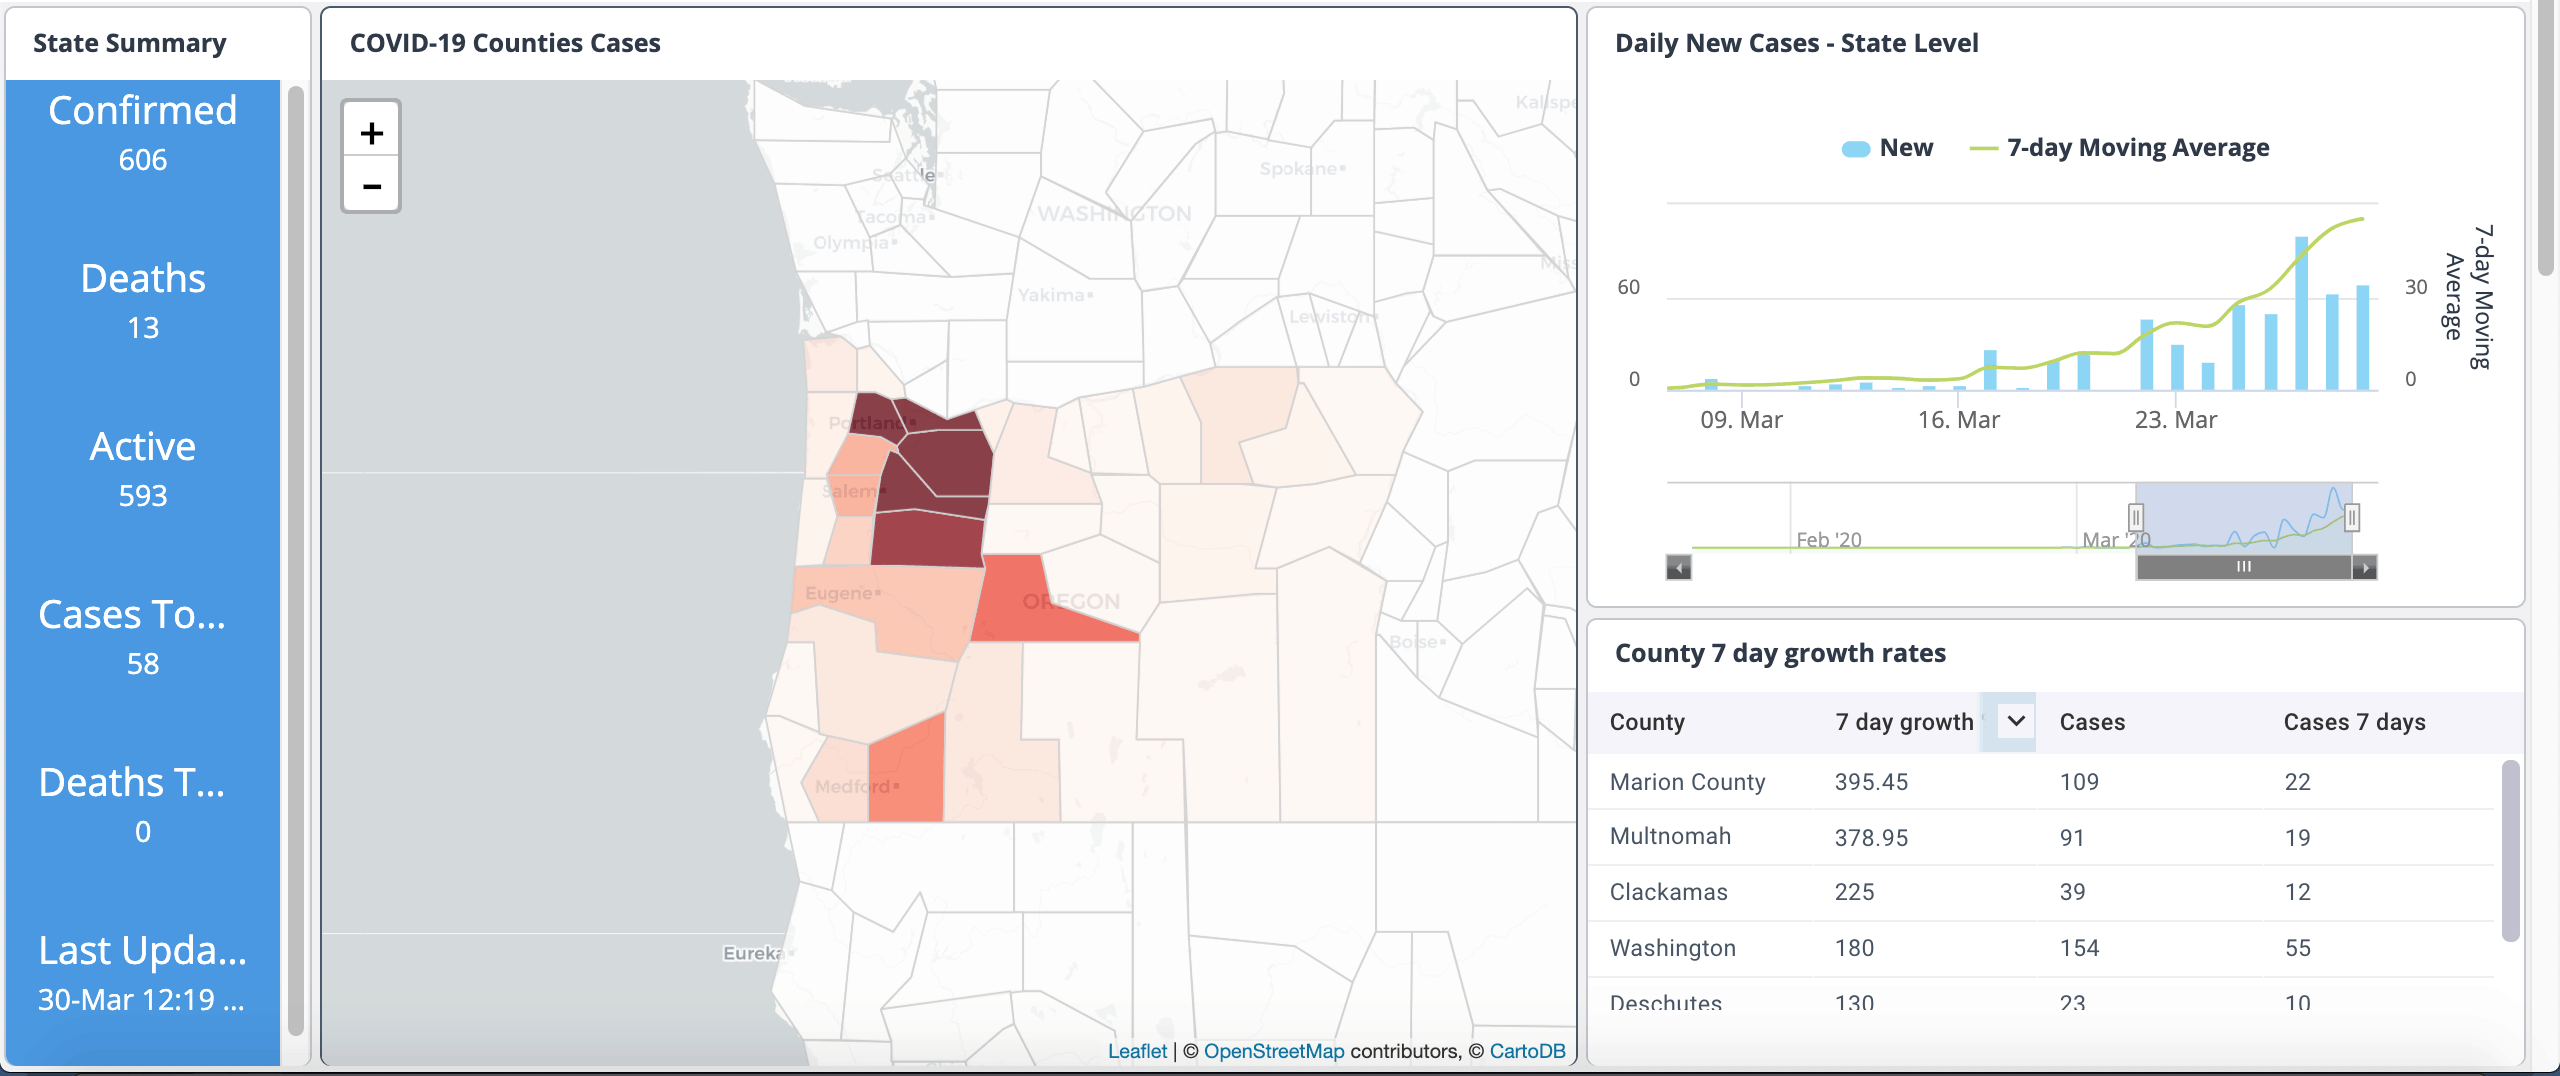
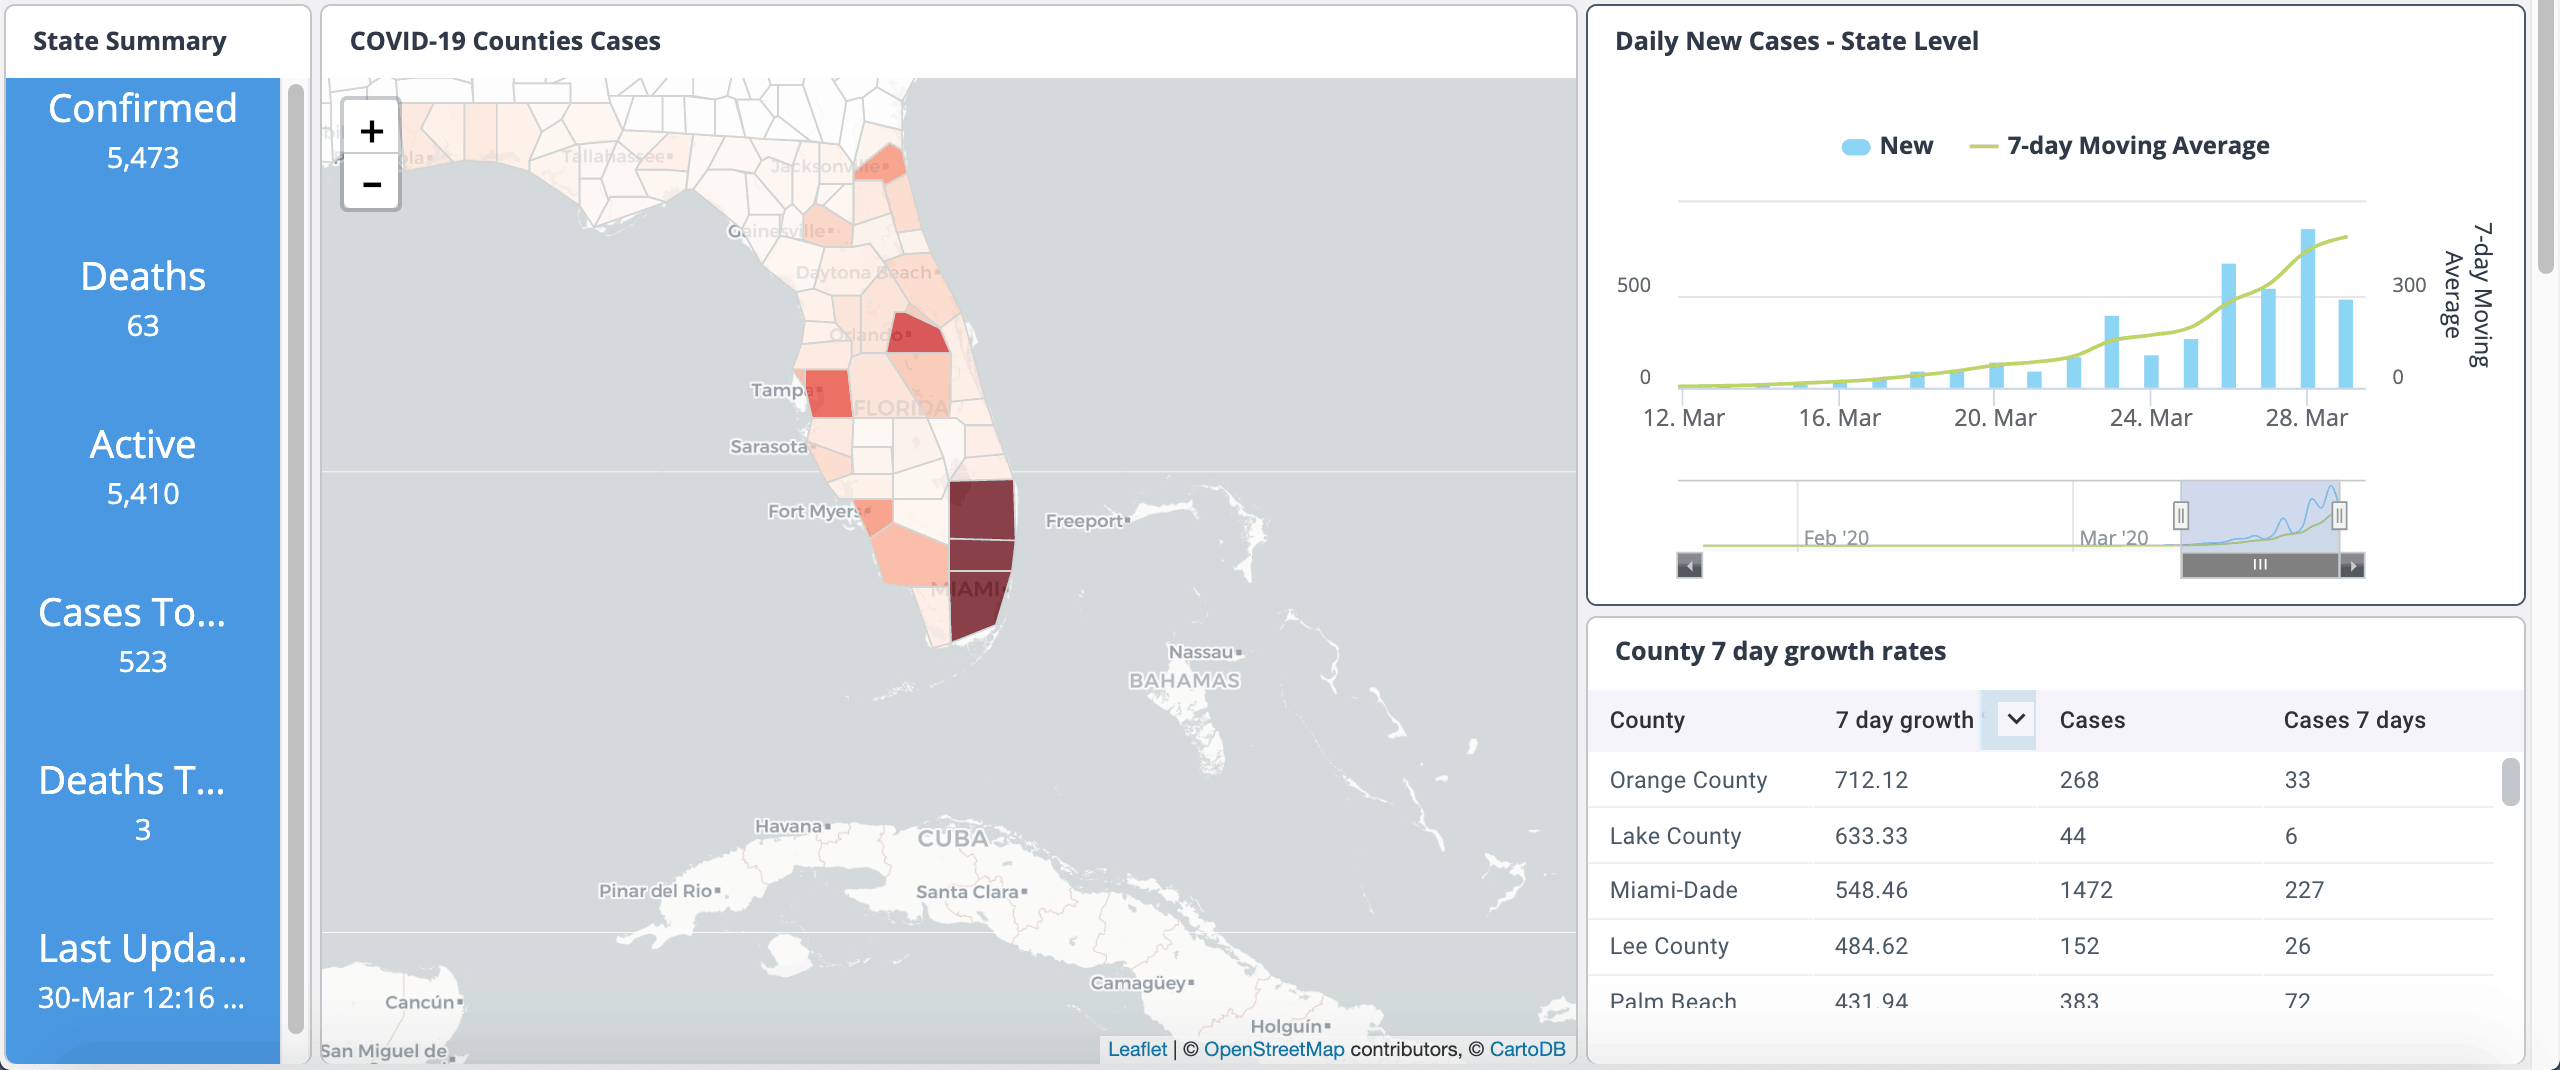
The dashboards provide current numbers of cases (confirmed, recovered, active, and deaths), and comprehensive data broken down by county/province. There are dashboards include: global scale, country level, and state & county level (for US).
Covid-19 Tests (US)
Known Covid-19 Tests in the US showing how many tests have been conducted by each state.
Data Access API
API layer to access the trusted datasets we’ve aggregated here.
Search-based analytics
Search driven analytics on various datasets.
Ask questions against various datasets in plain English and we’ll do our best to return actionable results.
We sincerely hope our Coronavirus Data Hub will be a helpful, data-based tool that individuals and organizations can use to ensure they are obtaining accurate information.
We’re always interested in improving the work we do. To that end we welcome feedback, ideas, or input via email about how we can make our Coronavirus Data Hub better – support@knowi.com.
Questions & Answers
About these COVID-19 dashboards
The data used in these dashboards is primarily from the John Hopkins University Coronavirus dataset and includes data from the CDC, and WHO.
Depending on the current version of the dashboards we may also be pulling in data from this public repository and this Github repo of the John Hopkins data.
The projection data on the COVID-19 Projections Dashboard is from IHME and assumes full social distancing. For more detail on this data, take a look at this article we put out.
Full list of data sources:
| Dataset | Source |
| States Testing Data Current | covidtracking.com |
| States Testing Historical | covidtracking.com |
| Raw County level Data | https://static.usafacts.org/ |
| Latest Day County Level Data | https://static.usafacts.org/ |
| County 7 day growth rates | https://static.usafacts.org/ |
| States Realtime API | corona.lmao.ninja |
| Realtime API | corona.lmao.ninja |
| John Hopkins Coronavirus Dataset | John Hopkins |
| John Hopkins Coronavirus Dataset US Only | John Hopkins |
| Death Projections and Hospital Projections | covid19.healthdata.org — IHME |
| MIT Model Hospitalization and Deaths Projections | https://www.covidanalytics.io/projections — MIT Model |
| Columbia University Model Hospitalization and Deaths Projections | https://github.com/shaman-lab/COVID-19Projection/raw/master — Columbia University |
The latest summary bars are near real-time (15 mins-30 mins). Other visualizations are typically updated once a day (when the John Hopkins dataset is updated).
Wonderful! We would love to check it out. Please send us an email at support@knowi.com or use the chat in the bottom right of the screen.
Yes please! Our goal is to help spread awareness and data to anyone who may need it.
We can provide an embed code to help with that. Please contact us using the chat in the bottom right or email us at support@knowi.com
No. These are just to track the spread of the virus and anticipate what will happen next.
Feedback & Input
About these COVID-19 dashboards
Health Resources
World Health Organization (WHO)
Centers for Disease Control and Prevention (CDC)
The worldwide dashboard provides a global view of the pandemic.
The latest summary bar is near realtime data of cases reported. Data for the other visualizations, including daily new cases, predictions and others are updated once a day.
You can segment by country using the Country filter at the top.
Worldwide Dashboards
Using the search-based analytics
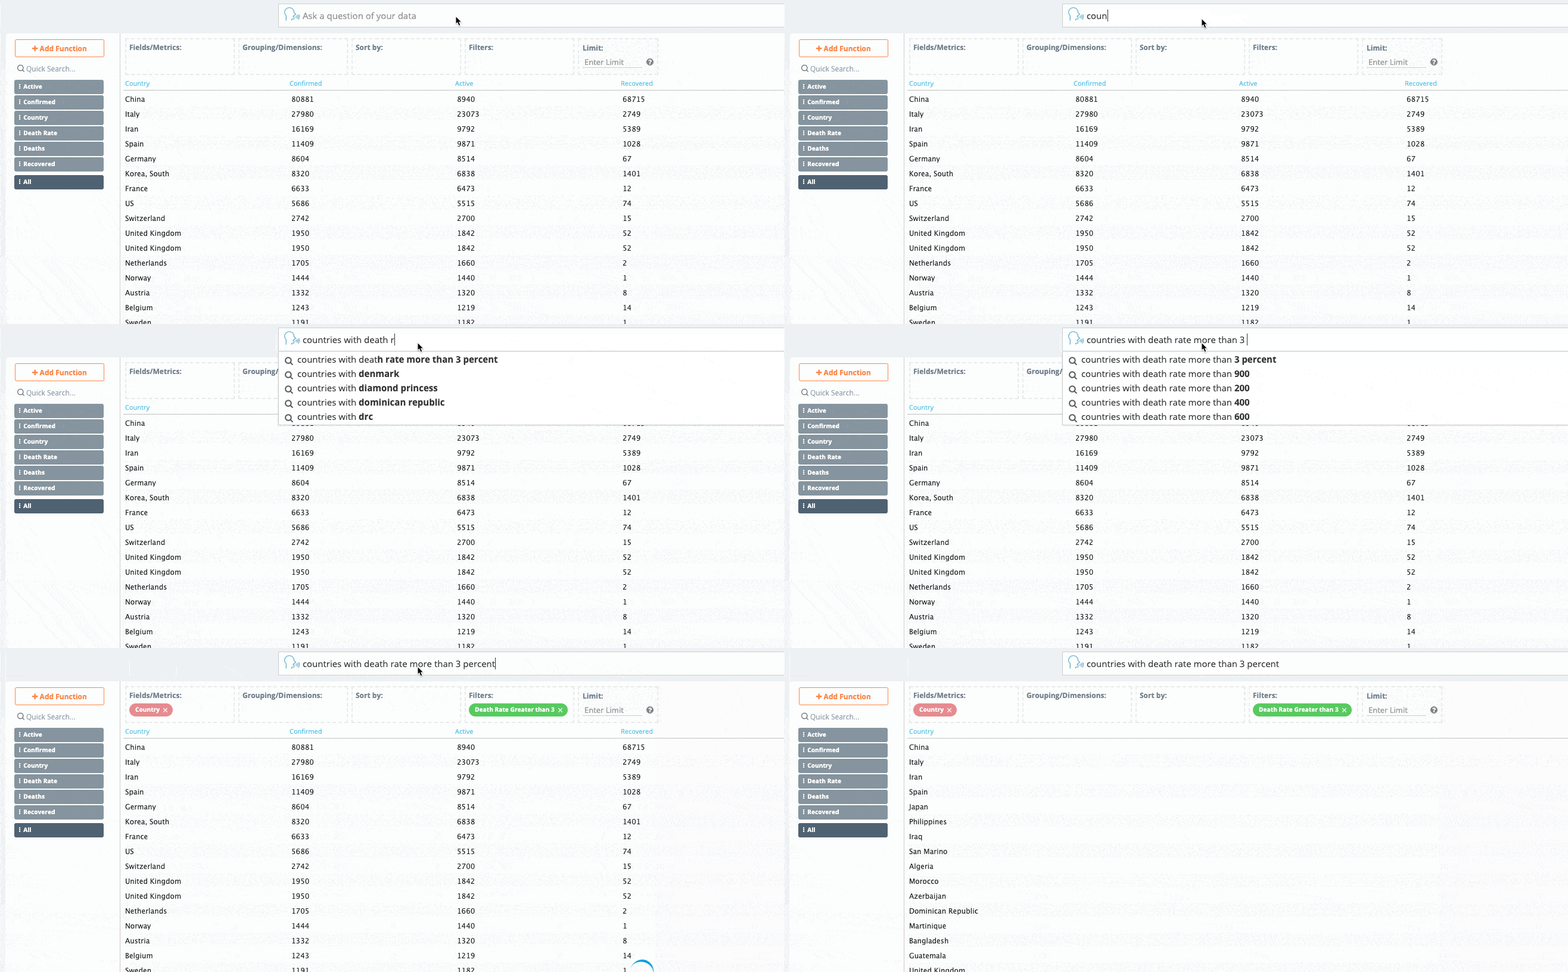
Search-based analytics (also sometimes called natural language querying) is where you ask questions in plain English and get back actionable data. It’s like Google searching your dataset.
We’ve implemented it here on the following two sets of COVID-19 data. Try asking the following questions and we will do our best to return you relevant results. You can download the dataset or export the results of your questions.
The first dataset only contains information at the country level whereas the second (larger) dataset contains more granular data at the county/provincial level where available.
Country Dashboards
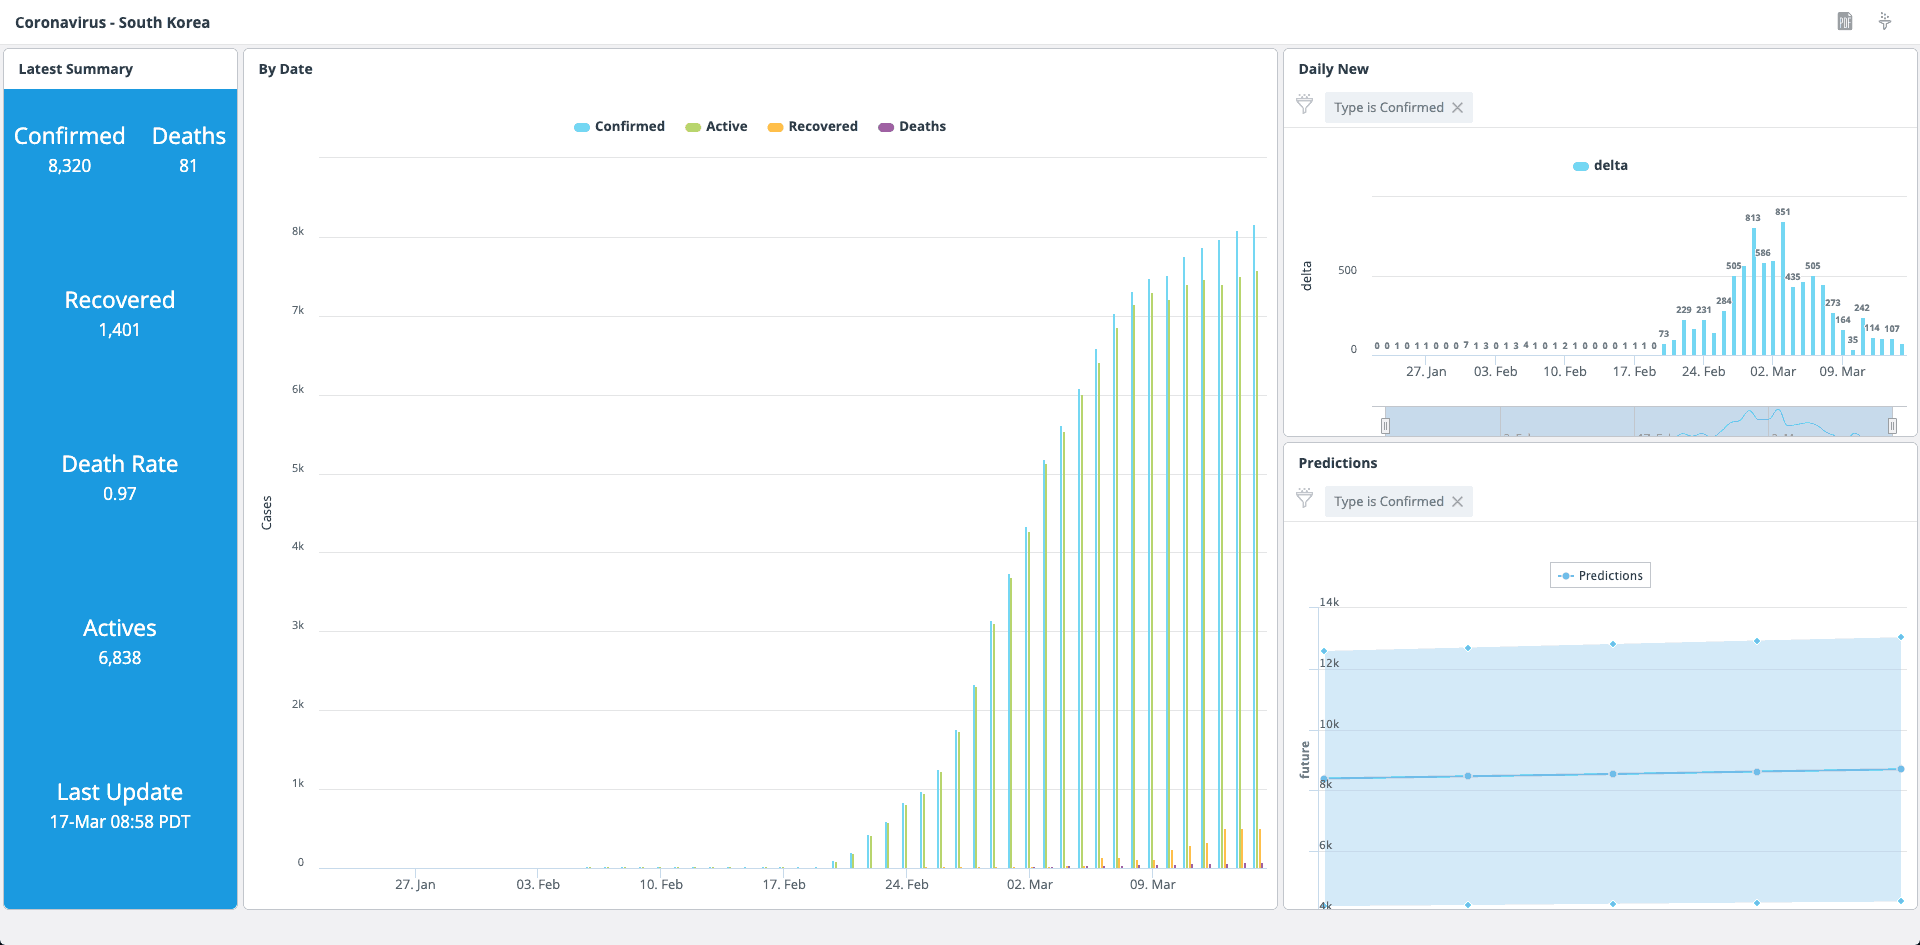
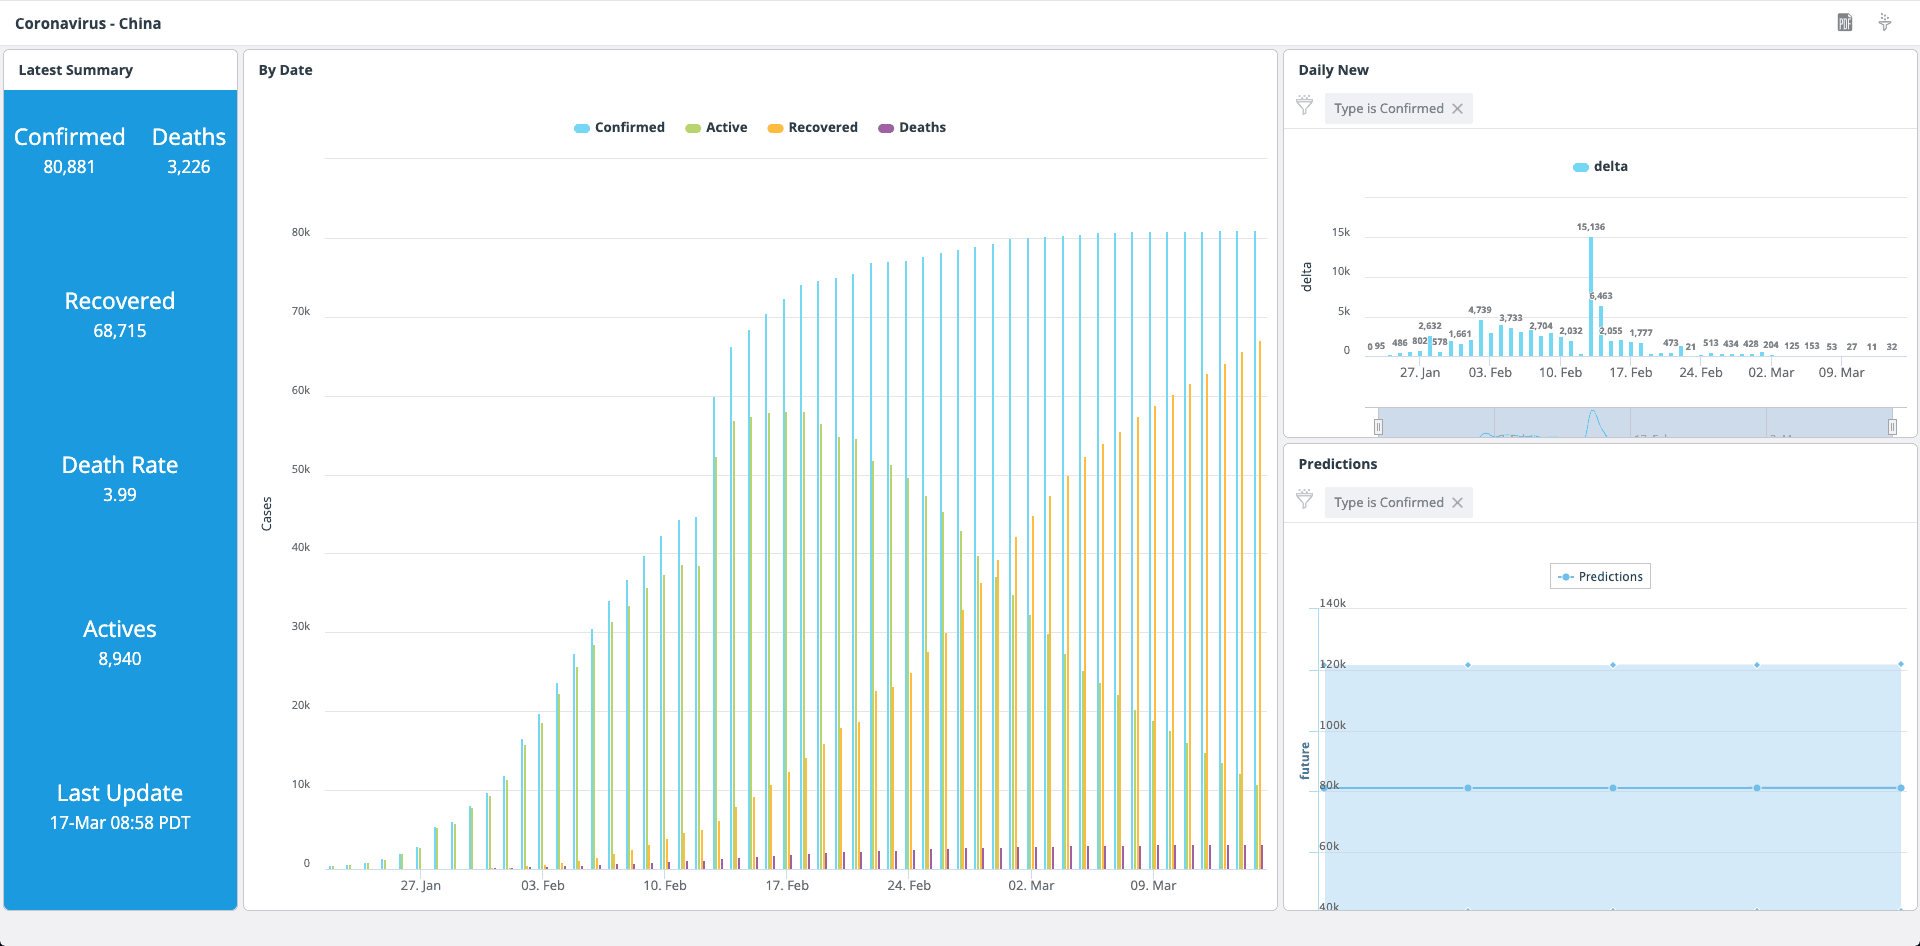
Dashboards for countries: United States, Italy, China, South Korea, Australia, Spain, India, and the UK. If you’d like to see dedicated dashboards for other countries, email us at support@knowi.com
US State / Region Dashboards
Dataset: Latest Country Level data
This dataset has the latest tally of cases across all countries.
Examples:
“United States”
“How many cases in Ethiopia?”
“Countries with death rate greater than 3 percent”
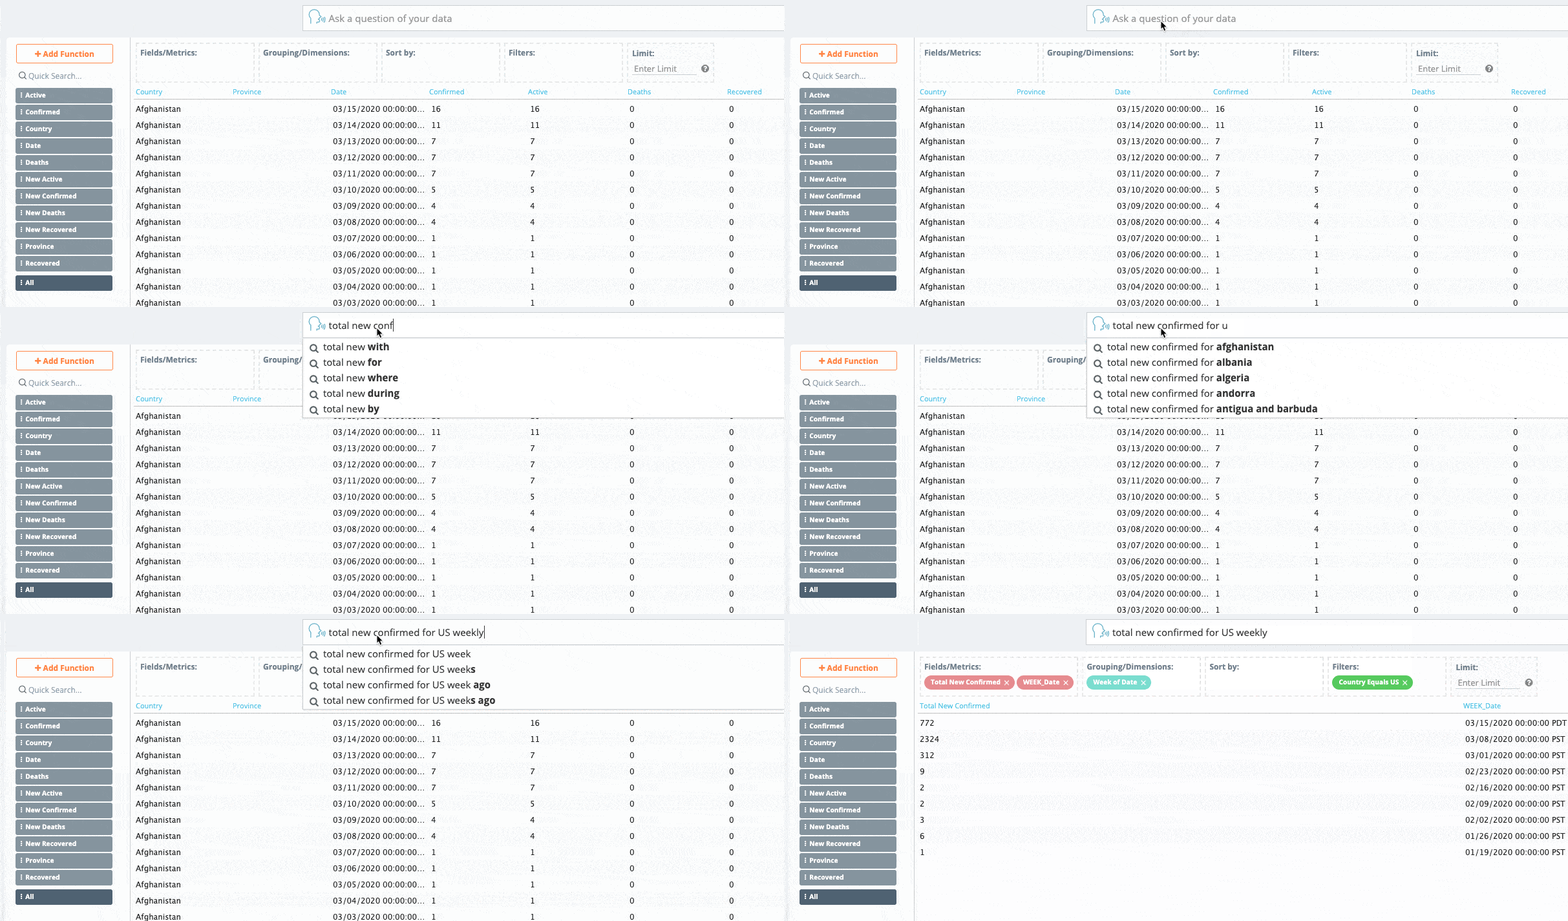
Dataset: Country and Province Daily History
This dataset contains county/provincial (where available) and country level data on a daily basis.
Examples:
“Total new confirmed for US weekly”
”total new confirmed in California in the last 10 days”
“total new confirmed by country in the last 7 days descending top 10“

