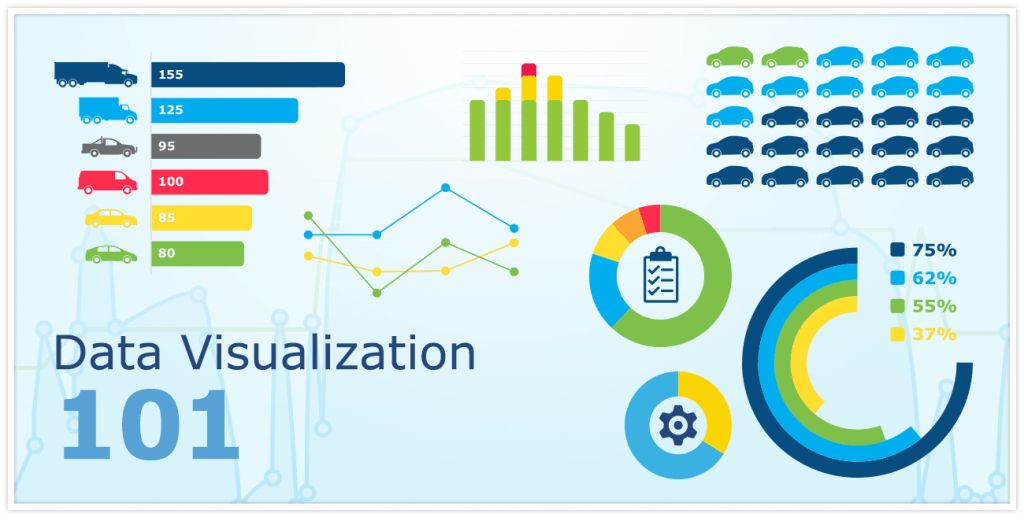
Choosing the right visualization to tell your story is important, as the wrong visualization can cause confusion and distract your audience. We walk you through dozens of visualization types and how to best use them to get your point across.
We all have our go to charts for visualizing data but if you need to present data to others, you have to think from the viewer perspective. Picking the wrong data visualization can easily confuse the viewer and lead to mistaken data interpretation. Before you create a chart, first understand the reasons for the chart. Start by asking a couple of questions, What are you trying to convey? What conclusions do you want the viewer to see using their data? This will help you narrow down the type of data visualization to use.
COMPARING VALUES
There are two main categories for comparing values: 1) you want to compare one or many items to show low and high values; 2) and you want to show trends over a time period. For example, if you have specific time intervals you want to highlight, such as hours, months, quarters, Line, Column, or Area charts are good options. If linear progression is not available in the dataset, Column and Bar charts are commonly used for simple comparisons among items. If allowing for viewers to search data is required, Data Grids (tables) or Pivot Tables are typically used.
CONVEYING RELATIONSHIPS
Relationship charts are suited to showing how one variable relates to one or more other variables. You could use relationship charts to show correlation or connections between variables in a data set. For example, Scatter Plot, Bubble, Heatmaps and Dual Axis Column charts are good for showing how something positively effects or negatively effects another variable over time. Cord Diagrams are a really interesting way to show connections between the data.
SHOWING DATA COMPOSITION
Data composition charts show how individual parts make up the whole of something and change over time. These charts are used to show how something is divided up. The only rule to remember is the sum of the parts must total 100%. If you have relatively few data points, Pie, Doughnut and Stacked Column charts are good options. If you have a large number of data points, try using a Treemap to keep the visualization compact but still readable. Sankey is a good option to show flows as well as proportion such as user behavior flow through app pages. Waterfall charts are used to understand the influence of several positive and negative factors on the initial value. They are typically used for financial reporting such as visualizing financial statements.
SHOWING DATA DISTRIBUTION
Visualizing the distribution of data in a given interval, geographic area, etc. is a great solution for quickly spotting outliers, clustering trends, and relationships within a data set. Bubble, Heatmaps, Box Plot visualizations display frequency, how data spread out over an interval, or how data is grouped. Maps also show frequency and data spread but add geographic context so are often used for population-based visualizations. Word Count diagrams are used to show text-based distributions. For example, Word Count can quickly visualize top revenue generating customers
KEY PERFORMANCE MEASUREMENT
If you are building executive or business performance visualizations, you typically want to include Key Performance Indicators (KPI) measurement. These visualizations are great for displaying a single value/measure within a quantitative context such as comparing to the previous period or to a target value. It allows viewers to see, at a glance, totals such as sales, revenue to target, number of active users, etc.
This is probably the easiest data visualization type to build with the only consideration being the period you want to track. You just need to remember that less is more with KPI visualizations. KPIs can be very impactful on a dashboard but the more of the same type of visualization you add the more you risk diluting the key metrics. Reserve these visualizations for the important metrics you want to immediately draw the viewers attention towards.
IOT ANALYTICS
In IoT use cases, typically the end users are non-technical so selecting the right visualization is critical to making complex IoT data easily consumable. Simplifying the IoT data story can be accomplished using a variety of visualizations including Timelines, Heatmaps, Geo-cluster, and Image overlays. For example, a Timeline diagram can instantly show if all the lights in a building were off overnight. A geo-cluster diagram or image overlay can show where sensors are deployed and their health with drill-down capabilities to see specific device details. Bubble charts and heatmaps are a quick way to highlight anomalies for further introspection.
To Download a PDF version of this article click here or learn more at knowi.com


