Amidst all the buzz around data science and machine learning nowadays, one might be lead to believe that business intelligence (BI) has lost its importance. But they cannot be more wrong, as big enterprises are actually relying on business intelligence more than ever to augment their decision making along with data science. And a number of companies run on more traditional business models are just now making the jump to digital transformation. As per a report, the BI market stood at USD 20.5 Billion in 2019 and is projected to grow to USD 40.5 Billion by 2025, at a CAGR of 12%. Tableau is still the market leader of BI tools, while Microsoft also expanded to the BI tools segment by launching Power BI a few years back. We also have relatively new startups like Knowi who are trying to expand the boundaries of traditional business intelligence. All this also shows that business intelligence is still an active space that is only going to grow in the coming years.
Within the BI tools, we see a lot of comparisons happening between Power BI vs Tableau due to their widespread popularity. But we thought it would be interesting to do an article with a 3-way comparison between Tableau vs Power BI vs Knowi and see how they stand with each other. Before diving into the comparison, let us get an introductory overview of each of them.
Tableau

Tableau Software was launched in 2003 and since then has withstood the test of time. If we are judging purely by the size of their user base, it is the clear winner among all BI tools currently on the market. Among the features of business analytics, reporting, and visualization it is Tableau’s glossy and attractive data visualizations that have garnered the most positive responses among BI users and helped Tableau to become the market leader in BI data visualization tools.
On June 10, 2019, Salesforce acquired Tableau in a stock-only deal worth over 15 billion dollars.
Power BI

Microsoft launched its proprietary business intelligence tool Power BI in 2015 for the general public as a stand-alone product. But a couple of years prior to that Microsoft had been bundling some of Power BI’s analytics and visualization features into Excel as an add-on. Power BI is integrated seamlessly with the Microsoft Office ecosystem and found instant popularity among the Office user base. In fact, one of the big selling points of Power BI was that it was a natural next step to move die-hard Excel users into a real business intelligence environment.
Knowi

Knowi is a modern business intelligence tool that is trying to distinguish itself from traditional BI tools by using data virtualization to eliminate the need for ETL. Knowi also differentiates itself by supporting native connectivity with NoSQL databases, allowing users to do analytics directly on unstructured data–something that has traditionally not been possible. It hosts all the regular features of any traditional BI tool but one of its most popular features is search-driven analytics powered by its Natural Language BI platform. Although knowi was launched in 2015 (the same year as Power BI), they stayed in relative stealth mode for the first few years as they focused all of their energy on building a BI Tool that could go head-to-head with some big-name competitors. That early due diligence paid off, as Knowi boasts some big enterprises in its client base.
PowerBI vs Tableau vs Knowi
Setup and Products
Tableau offers both the desktop client and online cloud access to its tools for users. Desktop users can choose from different products of Tableau Desktop, Tableau Desktop Personal, Tableau Desktop Professional. The cloud users can use Tableau Public (free) or Tableau Online. The enterprise companies can also have an on-premises installation with Tableau Server but they also need to have desktop clients to access reports on Tableau Server. And finally, Tableau Mobile enables mobile device users to seamlessly access reports on Tableau Server or Tableau Online on the move.
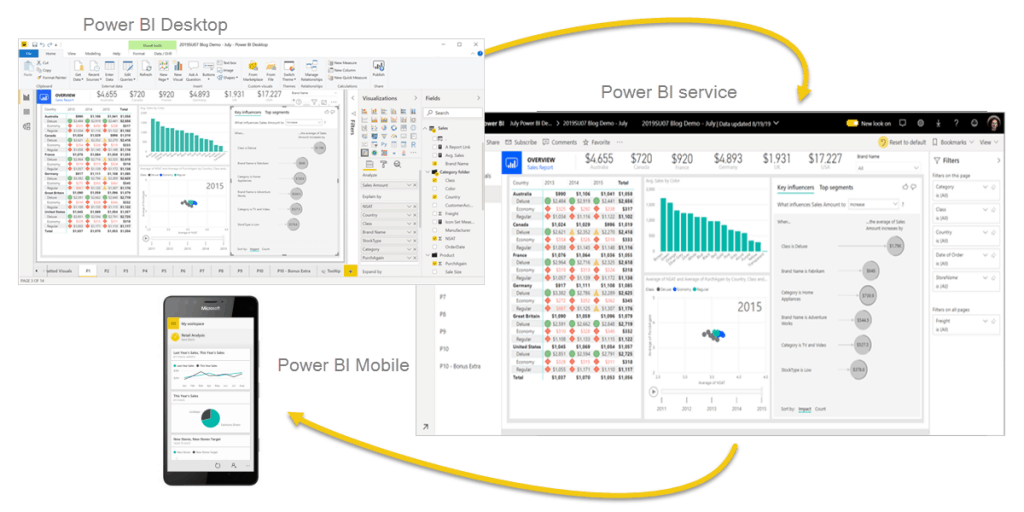
Power BI also offers products for both desktop and cloud users through its Power BI Desktop and Power BI Service respectively. On-premise installation for companies can be done using Power BI Server and Power BI Data Gateway. Power BI Mobile allows users to access reports on the cloud on their mobile devices.
Knowi provides the cloud-enabled platform and an on-premise version. Knowi, by design, does not support desktop installations, as it is optimized to run in the web browser as a SAAS BI platform. For enterprise users, Knowi offers options for Cloud/On-premise/Hybrid deployment. Knowi dashboards and analytics can be shared with mobile users and their embedded analytics engine can be added to mobile apps. But the Knowi platform itself does not have a mobile app version and does not generally allow users to do new analytics queries from their phone or tablet.
In terms of product range, both Tableau, and Power BI have similar offerings with little to separate between the two. On the other hand, although desktop users are still a large segment, Knowi is focusing only on the cloud users, betting on the future of the overall software market continuing its move towards a SaaS-first ecosystem.
Datasources
Both Tableau and Power BI can connect to essentially any data source that is structured or SQL-based. For data sources that are not SQL-based, Tableau and PowerBI users can still connect to them but will need to use a go-between like ODBC (Open DataBase Connectivity) drivers that translate into SQL. They can alternatively use ETL processes to move all of their data into an SQL-based data warehouse and apply schema.
Knowi supports more than 36 data sources that span the spectrum from structured to unstructured data (like MongoDB, Couchbase, Apache Cassandra, and Elasticsearch). Knowi is unusual among business intelligence tools in its ability to connect natively to NoSQL data sources. Knowi is most often employed in use-cases involving either MongoDB analytics or Elasticsearch analytics.
Another capability that is common across Tableau, Power BI, and Knowi is the support for REST APIs and REST API analytics. This opens more possibilities to integrate 3rd party applications with these BI tools seamlessly.
It is quite evident that both Tableau and Power BI stand neck to neck with each other when it comes to connecting to SQL-based data sources. Although Knowi explicitly lists fewer data sources on their website, in the end, it may actually connect to more because of its open support for NoSQL data and it’s much more flexible REST API integration. That said, their differing focus makes it tricky to do an apples-to-apples comparison on datasources/integrations.
Supported Data
Though both Tableau and Power BI are known to be used for analyzing big data, the user feedback for Power BI’s big data support is not as good as Tableau. Their limited ability to work with unstructured data has also been a source of friction in some of the more complicated use-cases.
Knowi works with any type of structured, unstructured, big or small data seamlessly. This is largely due to the fact that it provides a layer of data virtualization. This data virtualization enables it to work with any type of data without worrying about the underlying data structure and need for any ETL process. It also creates a flexible environment where users can perform cross-database joins, even joining data from a structured database like MySQL with that of an unstructured database like MongoDB.
Clearly the 3 tools support all types of data, however, due to in-built data virtualization, Knowi does bring something extra and unique on the table which the other BI tools do not bring out of the box.
Visualization
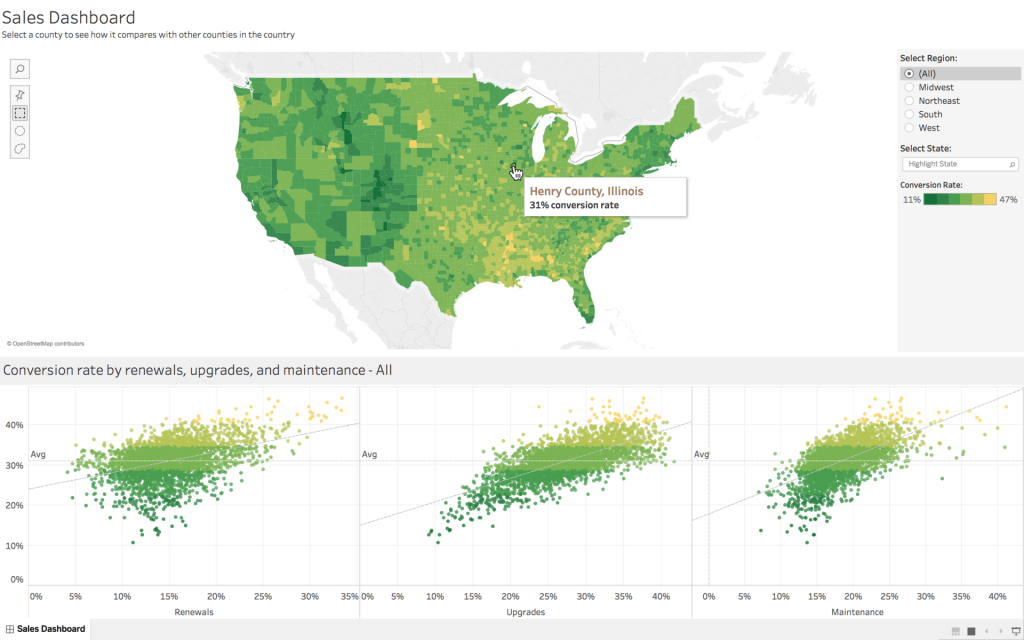
Tableau has built its popularity around its capabilities to produce the most stunning and intricate visualizations in the BI world. You can create powerful charts, graphs, maps, infographics, dashboards with plenty of settings that you can customize as per your creativity.
Power BI also provides a plethora of data visualization choices that you would expect from a Microsoft product. You will find almost all the standard and advanced visualizations similar to Tableau. It also enables you to create your own custom visualizations and put them up on their App source marketplace.
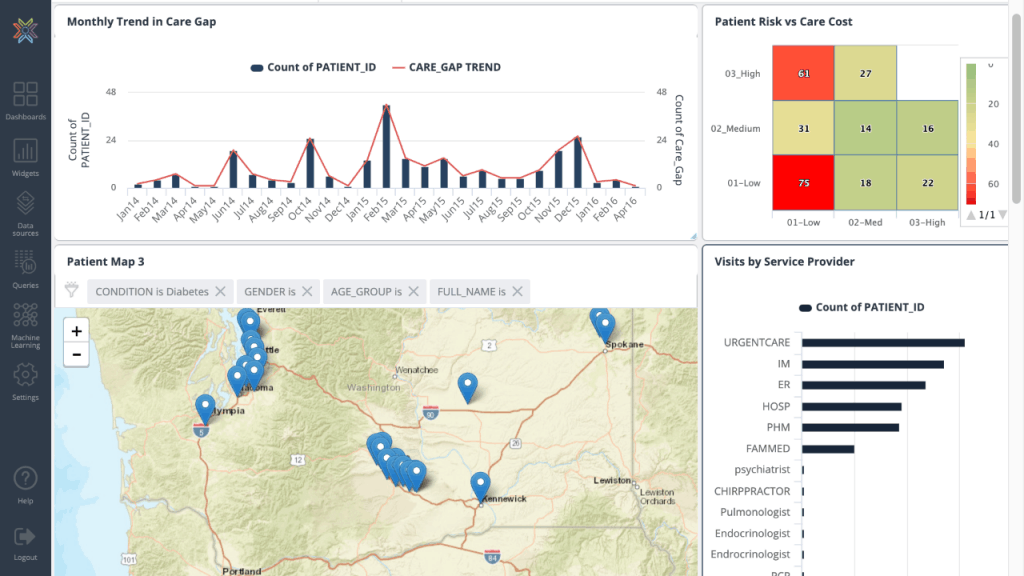
Knowi is not lagging behind much either from the above big boys and offers rich and highly customizable visualizations and dashboard options. It supports 30+ different types of simple and advanced visualization that should take care of most common data viz needs. In addition, Knowi allows users to create custom visualizations to suit their specific data needs.
There is no doubt that Tableau is the gold standard of data visualization tools in the market. On the other hand, we will say that both Power BI and Knowi give you all the standard data visualizations with all the customizations that you will need. But if you’re looking for a BI tool based on visual aesthetics alone, and you don’t need connectivity to a wide variety of complex data sources, Tableau may be the best option for you.
Analytics
Although Tableau is often looked upon as a data visualization tool it is also a robust platform for performing advanced analytics. It also recently introduced a new feature Ask Data, where a nontechnical user can simply ask a question on a search bar, and Tableau will interpret the natural language input and give the output to the question.
Power BI provides good analytics capabilities that are focused on both advanced and beginner users. Similar to Tableau, it also supports natural language query for performing analytics with conversational questions.
Finally, Knowi is also known for its next-generation analytics platform powered by data virtualization which makes it more convenient to query both structured and unstructured data. It also supports search-driven analytics enabled by the natural language query just like the above two tools.
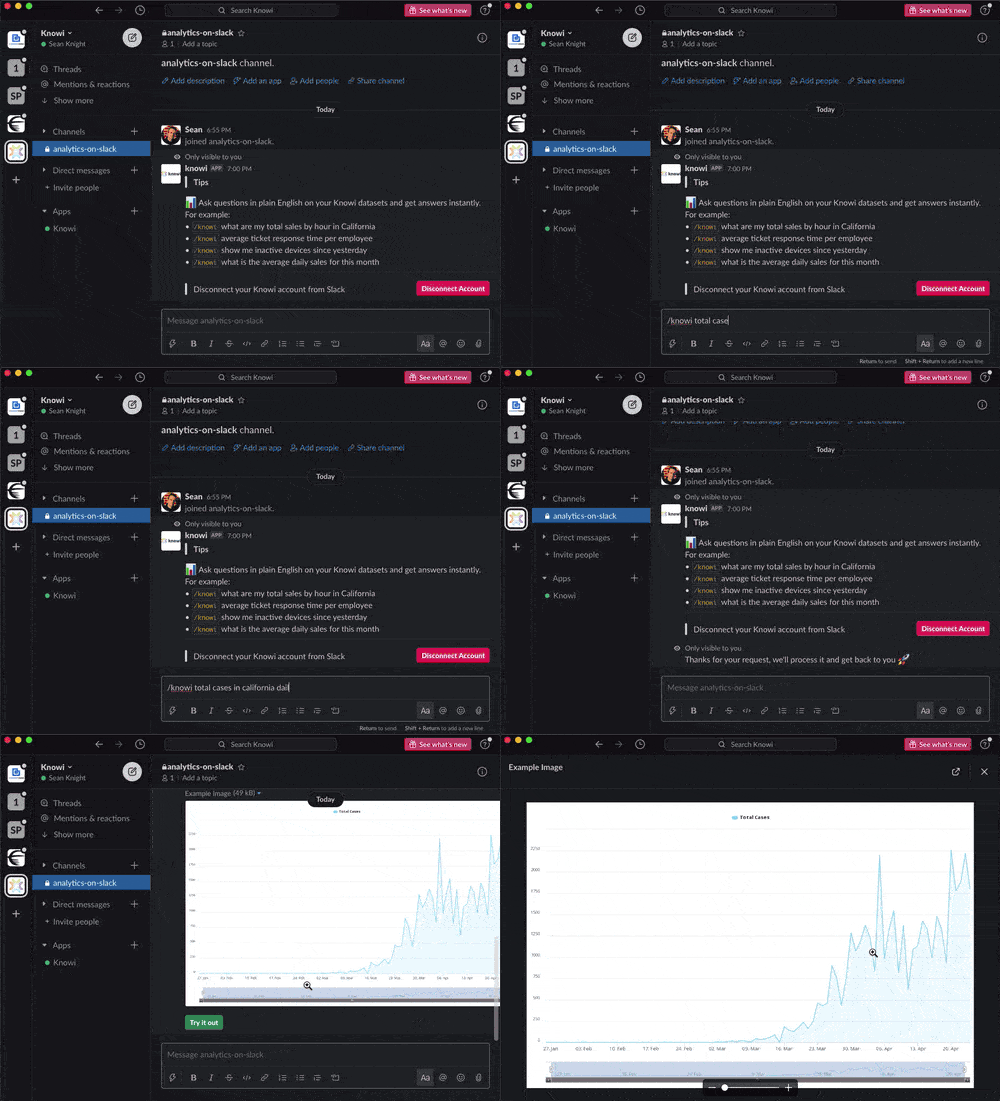
Recently, Knowi has unveiled search-based analytics in Slack. A new feature where you can ask your Knowi instance questions from within Slack in plain English and get back answers, charts, and data.
Artificial Intelligence
In the above section, we saw how all the three tools are leveraging natural language processing to provide natural language search-driven analytics. But this is not all, they all also offer some version of integrated machine learning features out of the box.
Tableau provides various machine learning features like clustering, predictive analytics, forecasting, smart recommendations, and Fuzzy matching.
Power BI also offers the creation of various machine learning models due to its integration with the Azure platform. Besides this, it supports text analytics and computer vision via cognitive services APIs.
Knowi too has built-in integration with many machine learning algorithms for Classification, Regression, Time-Series Anomaly Detection. It also has plans to bring clustering and deep learning capabilities into its platform soon.
Pricing
Tableau is known to be expensive and is not a pocket-friendly option for individuals or a small team. In comparison, Power BI starts from a low price point but if you scale up the license and addons then the price will shoot up drastically. In spite of this, with its low starter price, Power BI is a good choice for people who are looking for causal data visualization or analytics. This tracks with Power BI’s origins as an extension of Microsoft Office–it’s meant to be used by individuals or enterprise users.
Like Tableau, Knowi’s pricing point is also structured with a medium-sized company or big enterprise company in mind and is not a product for individuals. However, Knowi pricing is kept flexible to cater to the specific needs of the company and varies depending on requirements and use-cases. This flexible pricing model is tailored to each customer’s specific needs, whether deploying on the cloud or on-premise.
The contrast in pricing between Tableau and Knowi becomes starker as you look at scaling up. Tableau’s linear pricing model means additional cost for each new user, which can add up quickly. Knowi, on the other hand, bases it’s pricing on buckets of users. This means that as the user base grows, pricing tapers off and actually becomes more cost-effective.
One other thing to consider is that using either Tableau or PowerBI for enterprise analytics may come with the invisible cost of having to build out data warehousing infrastructure to get all data sources into a schema-bound data structure. Knowi’s no-ETL solution would avoid this cost in most cases.
Pricing can actually be a big differentiating factor when it comes to choosing the tool between Power BI vs Tableau vs Knowi, since different applications will value different features. A startup that is expecting to scale very quickly might pick Knowi for their flexible startup pricing for early days, and their bucketed user pricing model for as they scale. A small company that needs a cheap BI solution would likely pick PowerBI for the low barrier of entry pricing.
User Friendliness
All three tools have intuitive interfaces but if we do a comparison between the three then regular users might find Tableau a bit difficult to work with its advanced options. The nontechnical or not so advanced users, who generally have limited use cases, will find Power BI easier to use–especially if they have a strong background in Microsoft Excel. Knowi uses a browser-based web app interface that will be familiar and make sense to most users, but their UI could use a little polish compared to the other two.
Tableau vs Power BI vs Knowi – Final Thoughts
As we saw that in almost all the comparison parameters the three tools have stood up reasonably well against each other. Each tool not only had its own advantages and disadvantages but also brought its own unique offerings.
If you are an individual then it is no brainer that you will probably want to go with Power BI, as anything else is going to be prohibitively expensive.
When it comes to companies, and your focus is on the price point, then Power BI is again a good choice provided your team is not going to scale much in the future or you do not need the premium options. If this is not the case then Tableau can be a good choice to get value for money. If you are looking for flexible pricing options or are a startup then you may also want to go for Knowi, as they also have special pricing options for small startups.
If your organization is dealing with big data then Tableau will be a good choice compared to Power BI, if your budget permits. But if you do not have a big data warehouse with a well-defined ETL process then you may consider Knowi as well, since due to its data virtualization it does not require you to have all this infrastructure and without moving from the source.
It was interesting to do a comparison between Power BI vs Tableau vs Know. The landscape of BI has evolved a lot since the last few years due to the onset of big data, artificial intelligence, and the increasing enterprise use of unstructured NoSQL data. Both PowerBI and Tableau are trying to make the jump from being the business analytics tools they are now to becoming augmented analytics tools by incorporating machine learning features. Knowi stands a bit apart from these two in this regard. As a 3rd generation business intelligence platform it started with machine learning features in place. But as a smaller startup, it still has a lot of room to grow and some areas in the market where it needs to catch up to the other two solutions.
It will be interesting to see what new features these three platforms come up within the next few years.
