In the ever-evolving data landscape, leveraging the power of data analytics has become imperative for businesses of all sizes. A strong and efficient data analytics platform is no longer a luxury but a necessity, enabling organizations to make data-driven decisions, predict market trends, and customize their strategies to make the maximum impact. As the volume of data generated by businesses continues to skyrocket, the need for efficient, intuitive, and comprehensive analytics tools has never been more critical.
Choosing the right data analytics platform can be an intimidating task, given the number of options available. However, certain key features stand out that can significantly upgrade your organization’s ability to analyze data effectively. In this blog we look at the top 5 essential features that your data analytics platform should have in the current time. Each of these features plays a pivotal role in transforming raw data into actionable insights, streamlining operations, and ensuring that your business remains agile and informed in a competitive marketplace.
Embedded analytics refers to the integration of analytical capabilities within the business applications or operational processes that you already use. This integration facilitates real-time data analysis within the native environment of the application in use, eliminating the need to toggle between different systems or platforms.
Embedded analytics is crucial for democratizing data access and steering the adoption of data analytics across teams. It helps give your teams access to powerful BI tools within the applications they use every day. Embedded Analytics can also reduce the time taken to extract value from data by allowing teams to work together.
To be a data-driven organization, your team needs open access to analytics. Your data scientists, data engineers, and non-technical decision makers all need to be able to ask questions and get back real data-driven answers. Historically, it has been difficult for non-technical users to get even basic analytics information about how their company is doing. Company decision makers often don’t have time to learn a complex business intelligence tool. That’s where natural language processing (NLP) comes in and makes a huge difference.
Natural Language Processing (NLP) is the technology that enables software to comprehend human language as it is spoken and deliver intelligent responses. Within the realm of self-service analytics, NLP interprets plain language inquiries, contextualizes them within your business data, and generates a calculated response.
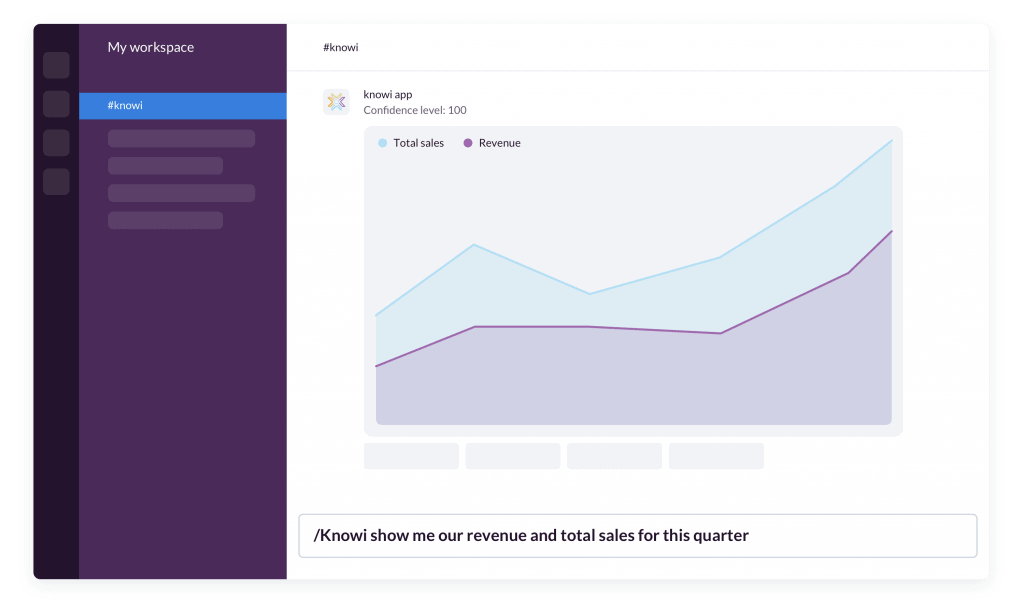
Imagine asking, “How many days have trial sign-ups exceeded 200?” or “Show me the total spent on marketing quarterly.” In response, you would receive a calculated answer and/or a visualization derived from your business data.
With NLP-based querying, top level decision makers, subject matter experts (SMEs) and anyone else who needs can run analytics queries. Self-service business intelligence combines AI analytics and NLP to remove the barriers to accessing analytics which significantly increases the potential of your data.
Furthermore, integrating this feature into widely-used collaboration tools like Slack and Microsoft Teams, as well as the ability to embed it within custom applications, ensures that organizations can maintain their agility and responsiveness. This allows for rapid, informed decision-making based on real-time data insights, an invaluable asset in today’s fast paced ecosystem.

- Instant Insights
Getting a BI tool that can be your partner on the journey of finding actionable data insights for business growth can be transformational for your business. Search for tools which help automatically generate narratives on your data or assist in crafting explanations that accurately convey the meaning and implications of the data insights, making it easier for you to understand and act upon the information. This kind of feature helps unravel key findings, trends, correlations, or patterns that otherwise would have to be manually done.
Today, data often resides in various sources and is distributed across different departments. Existing tools provide data which is typically isolated, allowing only for separate analysis. This approach of analyzing data in silos, without integrating it with information from other sources, tools, or departments, can lead to significant challenges. Operating within these data silos fails to present a complete overview, which can result in decisions made on incomplete knowledge.
Data integration is a vital strategy for IT decision-makers looking to enhance their organization’s operational efficiency and decision-making capabilities. It addresses the issues of data silos and fragmentation, which can impede growth and productivity. By achieving a unified view of data, organizations can automate processes, streamline operations,make informed decisions, and drive business success thus maintaining a competitive edge in today’s faced paced environment.
However, integrating data across the organization presents challenges. Seamless data source connectivity, data security, governance, and compliance are some of the common hurdles.
Integrating automatic reports and alerts scheduling into your analytics strategy not only streamlines your operations but also enables prompt and data-driven decision-making, allowing you to respond dynamically to the changing market landscape.
This feature allows users to configure and automate the distribution of tailored reports, ensuring you receive up-to-date insights on a regular, predetermined schedule. By setting up specific triggers or conditions, users can receive real-time notifications about significant events or anomalies, such as unexpected dips in sales or critical inventory shortages.
Whether it’s a daily sales report, a weekly campaign report, or a monthly performance overview, scheduled reporting ensures that you have the pulse of the business at their fingertips. These proactive alerts enable swift action, preventing minor issues from escalating into major setbacks.


