Introduction to Cohort Analysis
Cohort analysis is an analytical tool used to understand customer behavior and improve customer engagement and retention. This type of analysis groups customers by a specific attribute, action, or period of time.
For example, a company might track the activity of customers who signed up for a service in a particular month, converted in a particular quarter, or made a purchase in a specific geographic location. By grouping customers together based on shared characteristics or experiences, businesses can gain a deeper understanding on what to improve and how customer behavior changes over time.
Cohort Analysis KPIs
There are several KPIs that can be used to track customer activity using cohort analysis. The following are some, but not all, KPIs to consider:
Retention Rate
The retention rate is a measure of how many customers continue to use a product or service over time. By tracking the retention rate of a particular cohort, businesses can gain insights into customer loyalty and identify areas where improvements can be made. For example, if the retention rate of a cohort is lower than expected, it may indicate that there are issues with product quality or customer service that need to be addressed for that particular cohort.
Churn Rate
The churn rate is the percentage of customers who stop using a product or service over a specific period. By tracking the churn rate of a particular cohort, businesses can identify areas where customer engagement and retention can be improved.
Cumulative Average Revenue Per User (ARPU)
The ARPU is a measure of the average amount of revenue generated by each customer over a specific period. By tracking the ARPU of a particular cohort, businesses can gain insights into customer purchasing behavior and identify opportunities to increase revenue. For example, if the ARPU of a cohort is lower than expected, it may indicate that there are opportunities to upsell or cross-sell additional products or services to customers.
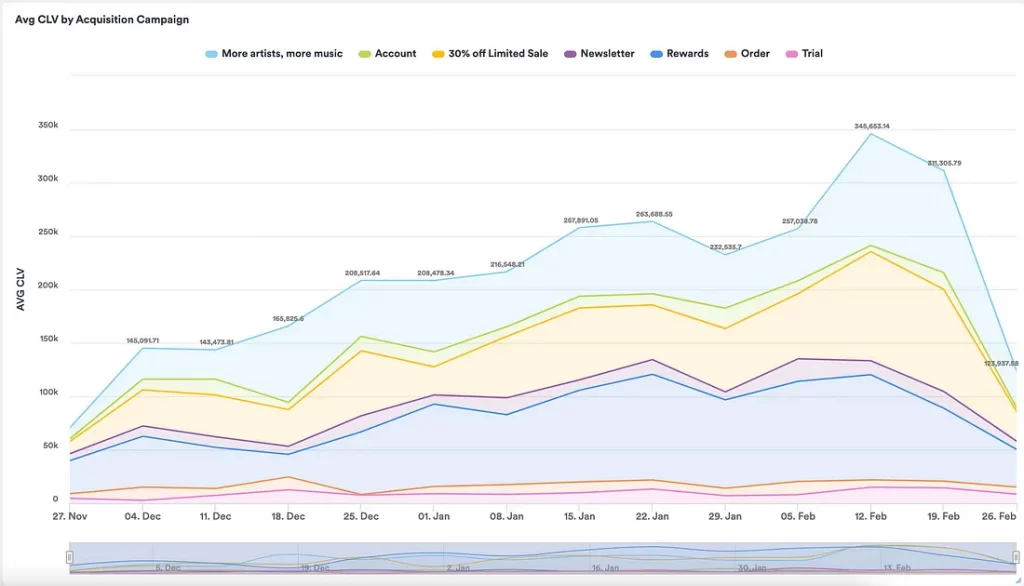
Customer Lifetime Value (CLV)
The CLV is a measure of the total amount of revenue that a customer is expected to generate over their lifetime. By tracking the CLV of a particular cohort, businesses can gain insights into the long-term value of a particular group of customers and identify opportunities to improve customer engagement and retention. For example, if the CLV of a cohort is lower than expected, it could mean that there are issues with customer retention or that additional marketing efforts are needed to increase customer loyalty.
Conclusion
In conclusion, using cohort analysis to track KPIs can help businesses identify targeted ways to improve customer engagement, retention- ultimately leading to increased revenue and growth.


