Knowi is a Redshift reporting tool that not only automates data discovery, querying, visualization, and reporting from Redshift but also from other unstructured and structured data sources.
It supports native queries into the Redshift database, thereby allowing you to avoid standard ETL processing, such as sending data into a structured warehouse.
Together, Knowi and Redshift enable data teams to deliver analytics on huge amounts of data in record time. This allows the users to take full use of Redshift’s speed and scalability, as well as quickly analyze data from Redshift and derive valuable insights.
In this blog post, we will explore:
- Querying a Redshift Database in Knowi
- Setting Up the Query
- Search-Based Analytics
- Visualizing and Automating Your Data
Let’s get started 🚀
Querying a Redshift Database in Knowi
You can query your raw data stores, connect against multiple data sources, and conduct transformations to deliver curated datasets to business users right away.
Adding queries to your Redshift database will filter the data into a single table for more straightforward analysis.
These can also be run in real-time against your database, or they can be stored for faster processing or to protect your database from frequent analytical workloads.
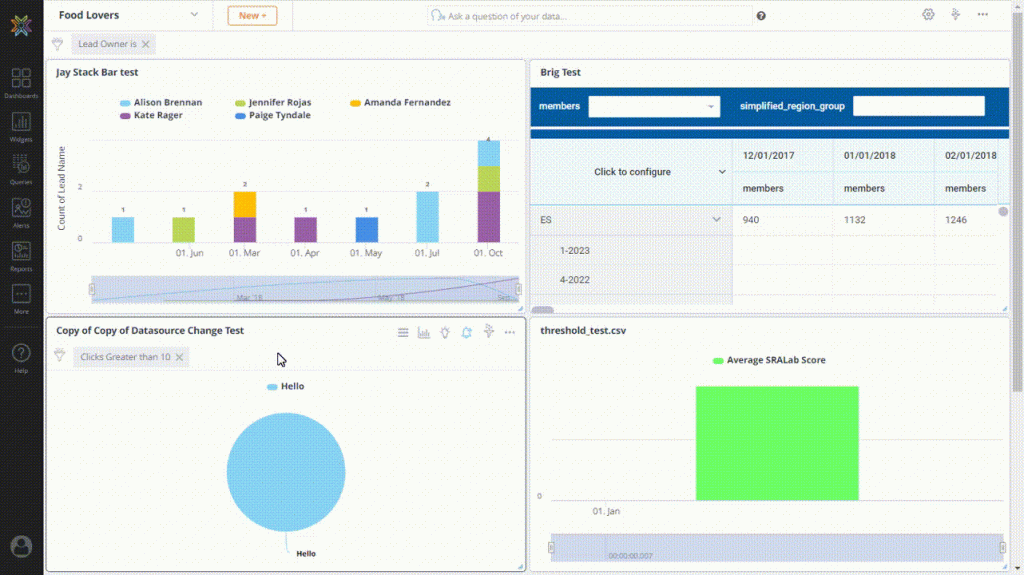
To add a new query to the Redshift datasource, you can follow the steps illustrated below
Setting Up the Query
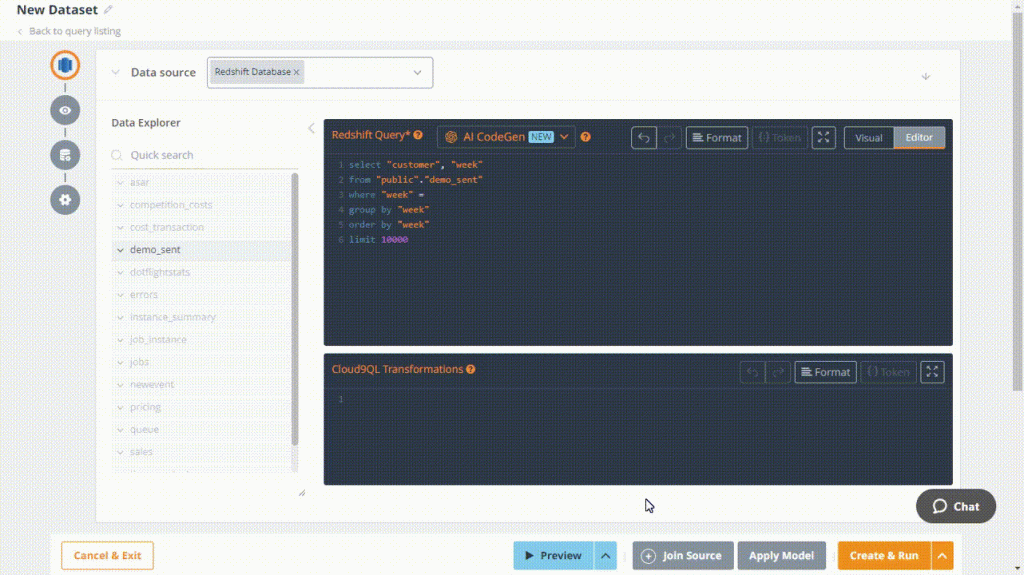
On selecting the Redshift Database, a list of collections, tables and field samples (or column names in the case of relational databases) are automatically detected in the Data Explorer.
You can begin constructing the Query with the help of these collections or tables by using the Visual Builder or by writing the query straight into the Query Editor.
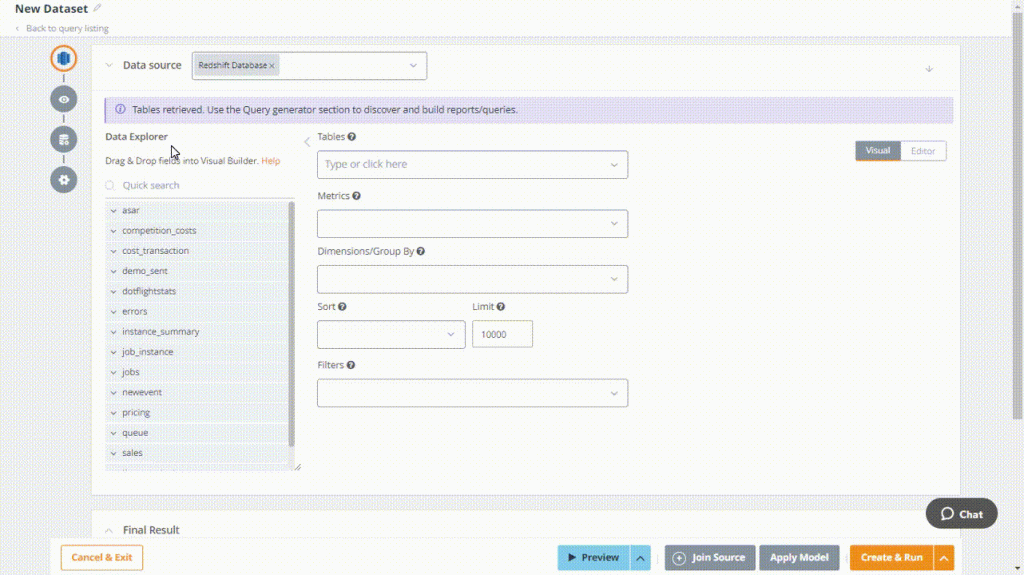
Visual Editor
Knowi will retrieve a list of tables as well as field samples after connecting to the Redshift datasource, using which you may quickly generate queries in a no-code environment using our visual builder by dragging and dropping fields or making drop-down selections.
| Fields | Description |
| Collection | Allows you to select a type of collection/table from the Data Explorer. |
| Metrics | Allows you to pull in fields and perform aggregations such as sum, count, avg., median, etc. along with date manipulations. |
| Dimensions | Allow you to group date-based fields based on date, week, etc |
| Sort | Allows you to sort the results. |
| Limit | Allows you to restrict the number of records to be fetched from the Datasource. |
| Filters | Allow you to specify the filters. |
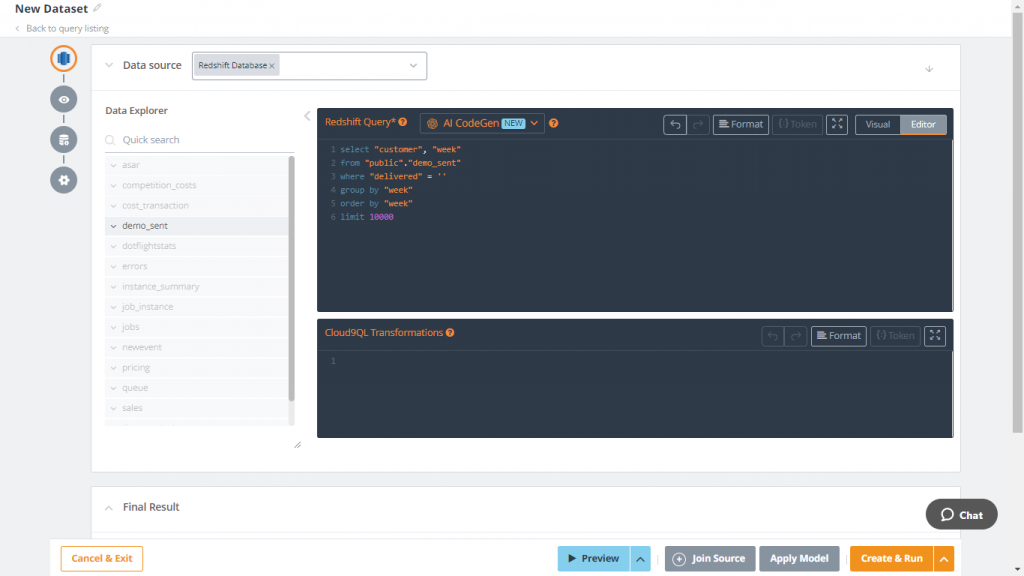
Query Editor
A versatile text editor designed for editing code that includes Redshift Query Language (RQL) and add-ons like Cloud 9QL, as well as an AI Assistant, which provides powerful transformations and analysis capabilities like prediction modeling and cohort analysis if needed.
Multi-source Joins
Knowi facilitates joins across multiple data sources to process and blend the data back together into a single result, along with the ability to store and track it. To add another datasource to the Redshift datasource, you can follow the steps provided illustrated below.
Data Execution Strategy
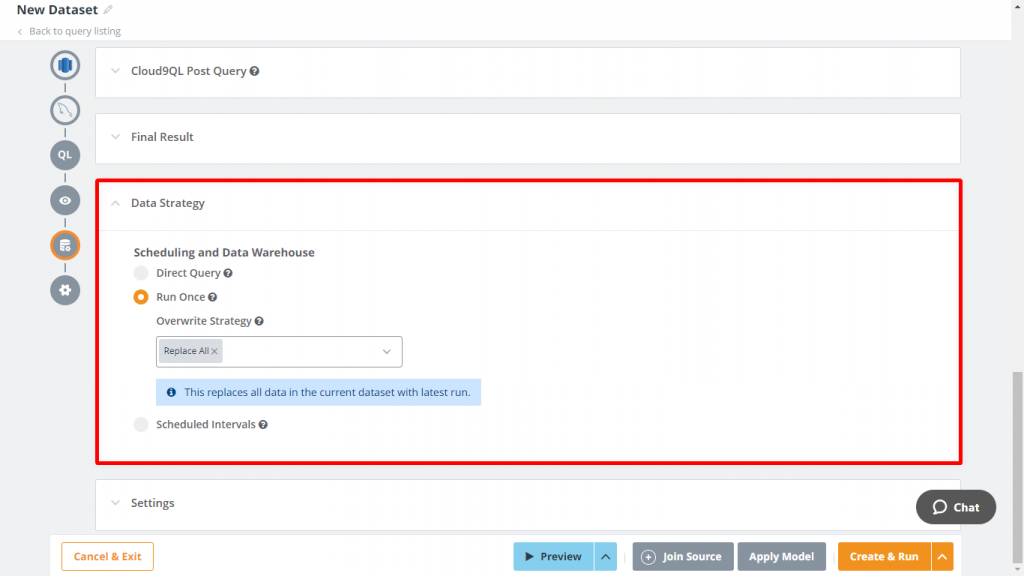
Using this data execution strategy, you can execute the query directly on the original Datasource, without any intermediate storage. When a widget is presented in this situation, it will retrieve data from the underlying Datasource in real time.
Define your data execution strategy using any of the options illustrated below:
| Options | Description |
| Direct Execution | Run the query directly on the original Datasource, with no storage in between. When a widget is presented in this situation, it will retrieve data from the underlying Datasource in real time. |
| Non-Direct Execution | Non-direct execution can be used if you run the Query only once or at regular intervals. These queries will have their results saved in Knowi’s Elastic Store. Long-running searches, lower database loads, and other advantages are available. |
| Schedule Intervals | Run the query at specified intervals. The results are stored in Knowi and the visualisations, alerts etc. are driven from the Knowi datastore. |
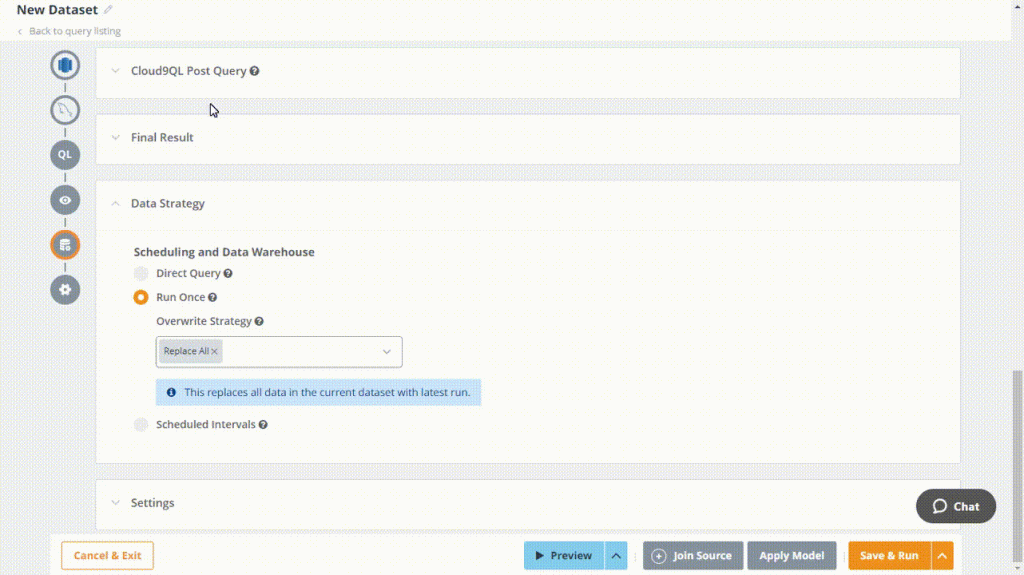
The result of your Query is called Dataset. After reviewing the results, you can name your dataset and then click the Create & Run button.
Search-Based Analytics
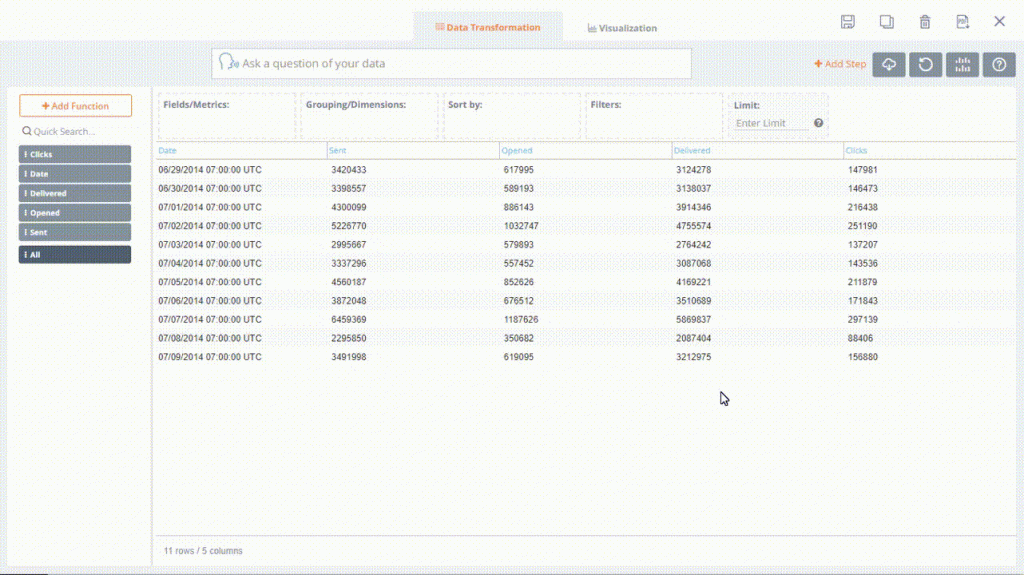
Knowi allows you to ask ad hoc questions in plain English using the Data Transformation search bar to fetch the data from your created dataset.
Visualizing & Automating Your Data
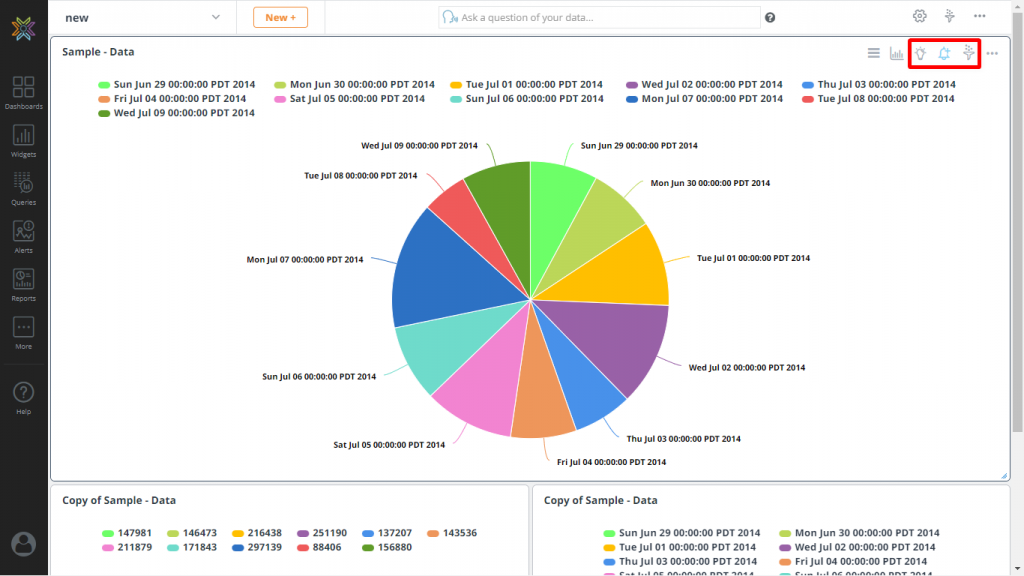
Knowi allows you to view the results for the same searched data in a chart, data grid and much more through the Visualization tab. If you’ve specified any manipulations on your data using Data Transformation, the visualization tab will reflect the data after manipulation.
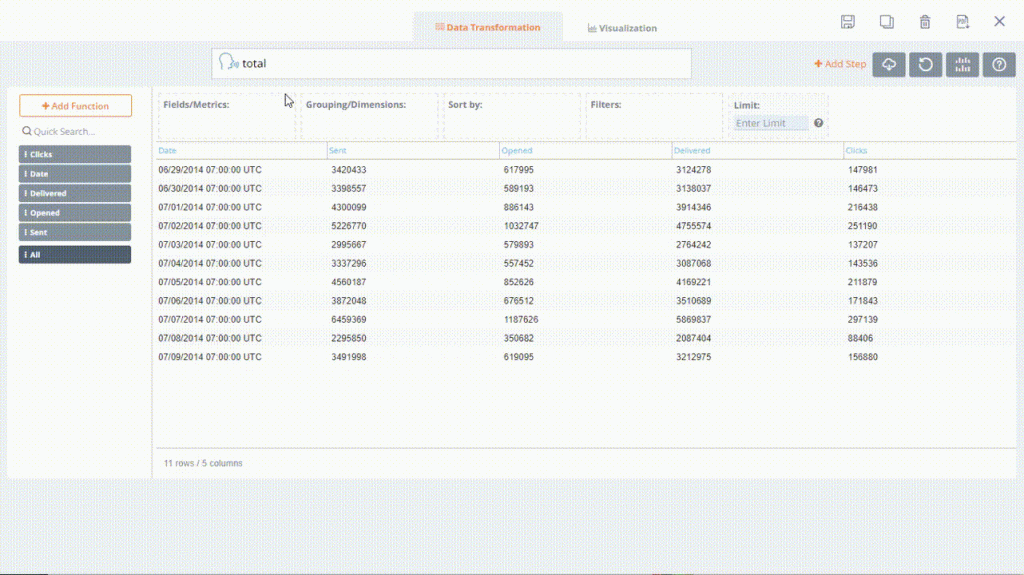
After that, perform various operations such as save, clone, or delete located at the top-right corner of the interface.
Further, to view instant sights, create alerts and add filters, navigate to the top-right corner of the interface and perform the necessary actions.
Conclusion
In this blog post, we connected to a Redshift Datasource, generated a query and joined the initial query with another Datasource (MySQL). The results of our query were saved in Knowi’s elastic data warehouse. We then used search-based analytics to filter and visualize our data, allowing the user to focus on a filtered area of the raw data that they wanted to learn more about. Knowi gives you the flexibility of storing your query results in our Elastic Store, a schema-less data warehouse as well as back into your own Redshift cluster.
In conclusion, Knowi is a powerhouse Redshift data analytics tool. The flexibility and simplicity in pulling in and aggregating your raw data makes Knowi the optimal choice for data teams that use Redshift, Other SQL/NoSQL datasources, APIs, and flat files. Try Knowi for free with our 21-day trial.
