Knowi provides native analytics capability into ElasticSearch that goes beyond what Kibana offers. With Knowi, you can explore add-on benefits like blending across multiple indexes, joining across the same or disparate SQL or NoSQL databases, natural language capabilities for self-service analytics, machine-learning anomaly detection, and more. The only Kibana alternative you need.
Table of Contents
- Introduction
- Connecting to ElasticSearch
- Writing a Query
- Create Visualization
- Natural Language Processing
- Bonus: Kibana Vs. Knowi
Introduction
This blog post is a quick dive to explore the limitless benefits of using Knowi as a Kibana alternative for native ElasticSearch analytics.
From connecting to ElasticSearch to using the natural language capabilities for generating visualizations at the speed of business, you will find how easy it is to use Knowi.
Connecting to ElasticSearch
Sign in to your Knowi account and connect to the ElasticSearch cluster hosted on the Elastic Cloud Service.
1. From the Playground dashboard, select the Queries from the left and click on the New Datasource + button.
2. Select ElasticSearch from the list of data sources
3. After navigating to the New Datasource page, enter the details like datasource name, Elasticsearch URL to connect to, Elasticsearch credentials, and other requested details.
4. Click Test Connection to confirm successful connection to the Elasticsearch cluster, hit the Save button, and start Querying.
Writing a Query
After connecting to Elasticsearch datasource, Knowi will pull out a list of indexes for you along with field samples.
Using these indexes, you can automatically generate queries through our visual builder in a no-code environment by either dragging and dropping fields or making your selections through the drop-down.
Tip: You can also write queries directly in the Query Editor, a versatile text editor that offers more advanced editing functionalities like ElasticSearch JSON Query, support for multiple languages modes, Cloud9QL, and more.
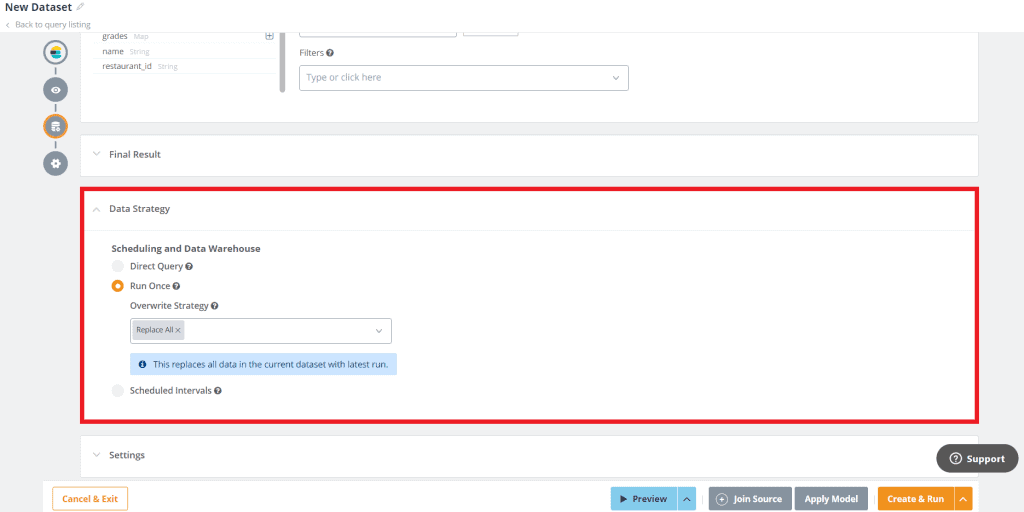
Moving forward, the users can define the data execution strategy by making a selection of any one of the following options:
- Direct Execution: Directly execute the Query on the original Datasource, without any storage in between. In this case, when a widget is displayed, it will fetch the data in real-time from the underlying Datasource.
- Non-Direct Execution: For non-direct queries, results will be stored in Knowi’s Elastic Store. Benefits include- long-running queries, reduced load on your database, and more.
Non-direct execution can be put into action if you choose to run the Query once or at scheduled intervals.
For more information, feel free to check out this documentation- Defining Data Execution Strategy

Click on the Preview button to analyze the results of your Query and fine-tune the desired output, if required.
The result of your Query is called Dataset.
After reviewing the results, name your dataset and then hit the Create & Run button.
The dataset you create serves as the foundation for most of the actions you’ll perform in Knowi. This includes creating visualizations, adding them to dashboards, natural language queries, alerts, and the list goes on.
Tip: You can also perform Joins across multiple datasources to process, blend and store combined results seamlessly with an additional ability to store and track the stitched data. For more information, feel free to check out this documentation- Multi Data Source Joins.
Create Visualization
Once you hit the “Create & Run” button, Knowi brings you to the dataset page where you can create a visualization.
With Knowi, you can build multiple visualizations, each with a transformed view of the original data from your dataset.
1. Click on the Create Visualization button.
2. By default, the data will be in a grid format. You can select the most suitable visualization type for your data and hit the Save button from the top-right corner.
3. Enter the Widget name and select the dashboard from the dropdown list to which you would like to add your visualization. Hit the +Create button when done.
{Note: You can also create a new dashboard and add your visualization to it by clicking on the + New Dashboard button}
4. Click on Go to Dashboard. You will be brought to the dashboard, and you will find the newly created visualization derived from your ElasticSearch datasource.
You can also create visualizations directly from the dashboard. For more information, feel free to check out this documentation- Widgets & Datasets
Natural Language Processing
The Natural Language Processing (NLP) capability from Knowi is a powerful feature that allows the users to activate self-service analytics by asking questions to the dataset in plain English.
Click on the Analyze button of your widget in the dashboard and ask a question to your data. For example, you can write- “count by borough by cuisine for Indian” and Knowi will generate a visualization for you from the underlying datasets you have access to.
Bonus: Kibana Vs. Knowi
The table below provides a high-level comparison of Kibana and Knowi and helps you understand why the latter is a Kibana alternative.
| Attributes | Knowi | Kibana |
| Native Integration to Elasticsearch | Yes | Yes |
| Supports AWS Elasticsearch | Yes | Yes |
| Number of Supported Visualizations | 30+ | 18 |
| Integrated Machine Learning | Yes | Yes |
| Share and Embed Dashboards | Yes | Yes |
| Blend Across Indexes | Yes | No |
| Blend with Other NoSQL or Relational Data | Yes | No |
| Natural Language Queries | Yes | No |