Exploring the Data World Platform
In today’s digital age, data is often referred to as the new oil fueling innovation, driving decision-making, and transforming industries. With exponential data generation, storage,
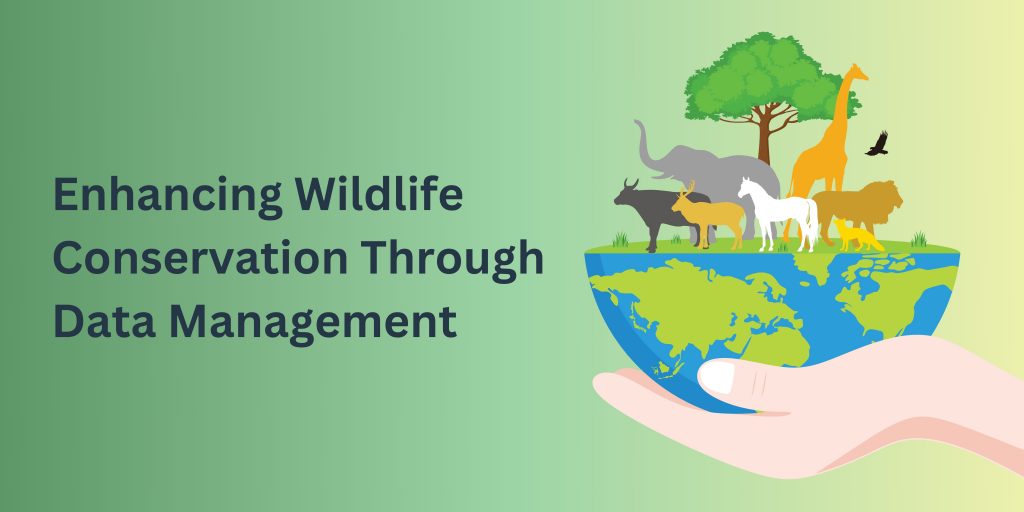
Enhancing Wildlife Conservation Through Data Management with Knowi
Learn how Knowi helped a leading conservation organization in North America to revolutionize their environmental protection and sustainable management efforts.
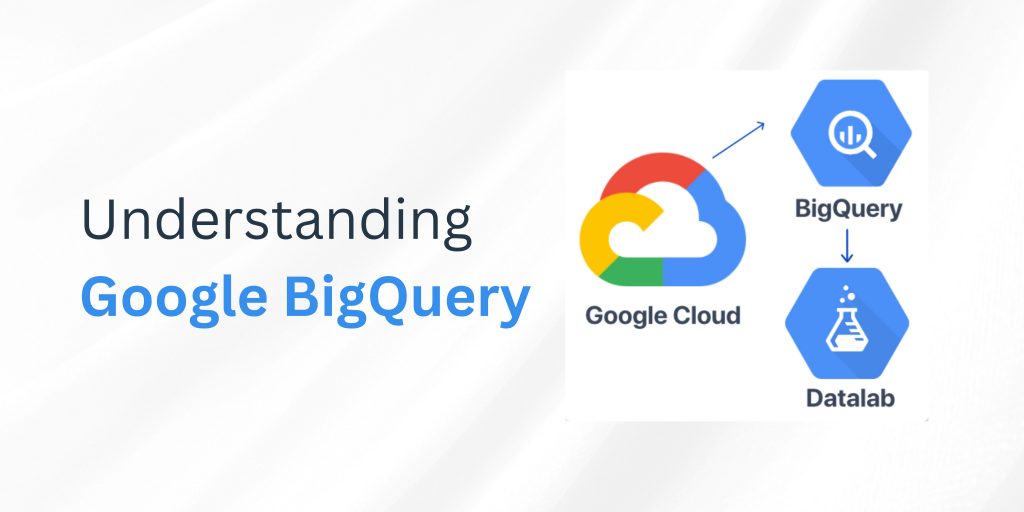
What is Google BigQuery? Complete Guide [2026]
Master Google BigQuery in 15 minutes. Learn what BigQuery is, pricing, SQL examples, and how to analyze petabyte-scale data.
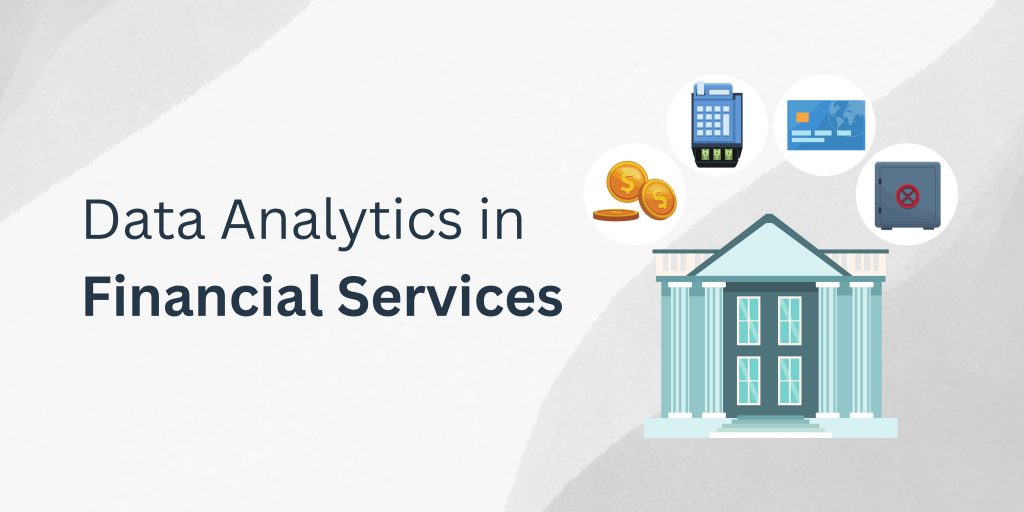
Data Analytics in the Financial Sector
Explore how data analytics revolutionizes the financial sector: from risk management and customer personalization to tackling challenges and embracing trends.
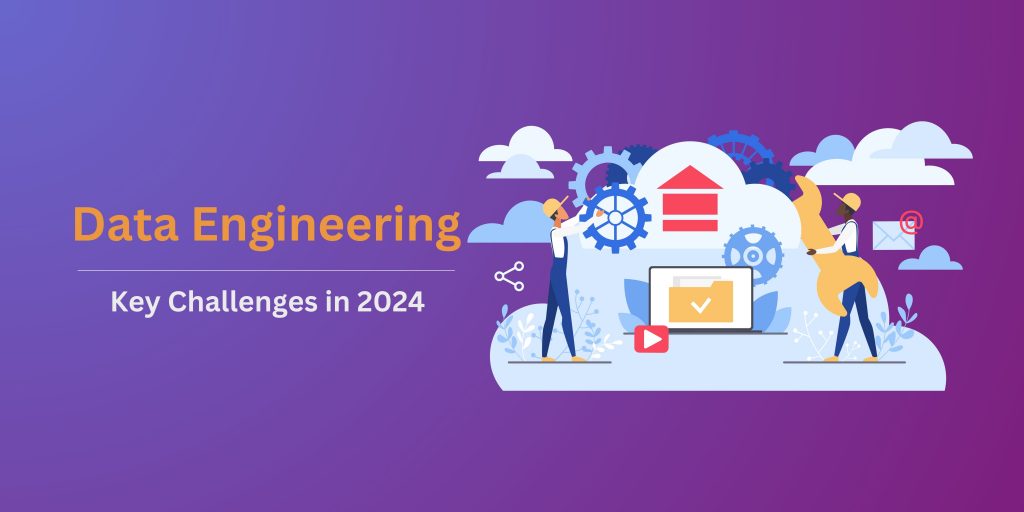
Key Data Engineering Challenges in 2024
In this blog post, we discuss the challenges in the data engineering domain, providing a comprehensive understanding and strategies to overcome these obstacles.
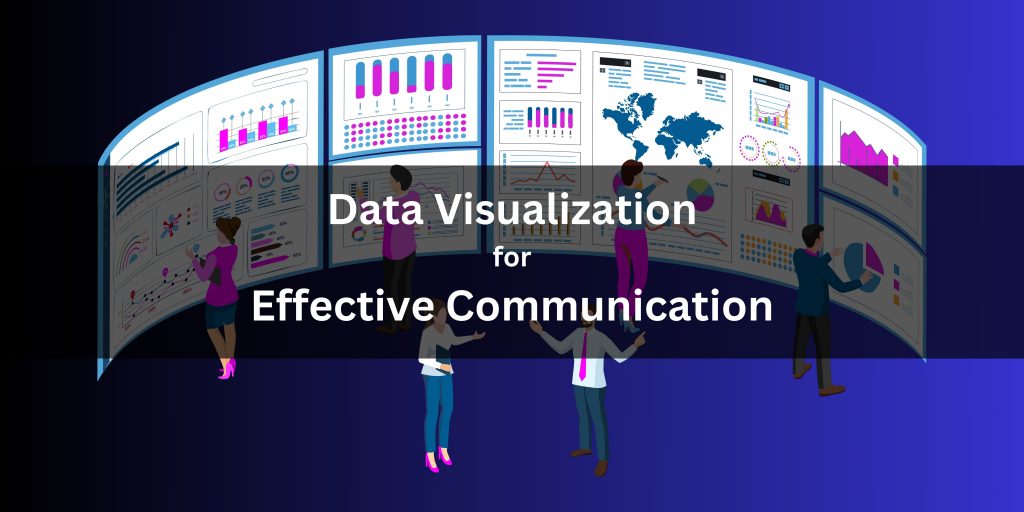
Data Visualization for Effective Communication
Learn how to simplify complex info, highlight trends, and engage your audience with visual storytelling. Use Data Visualization for effective communication.
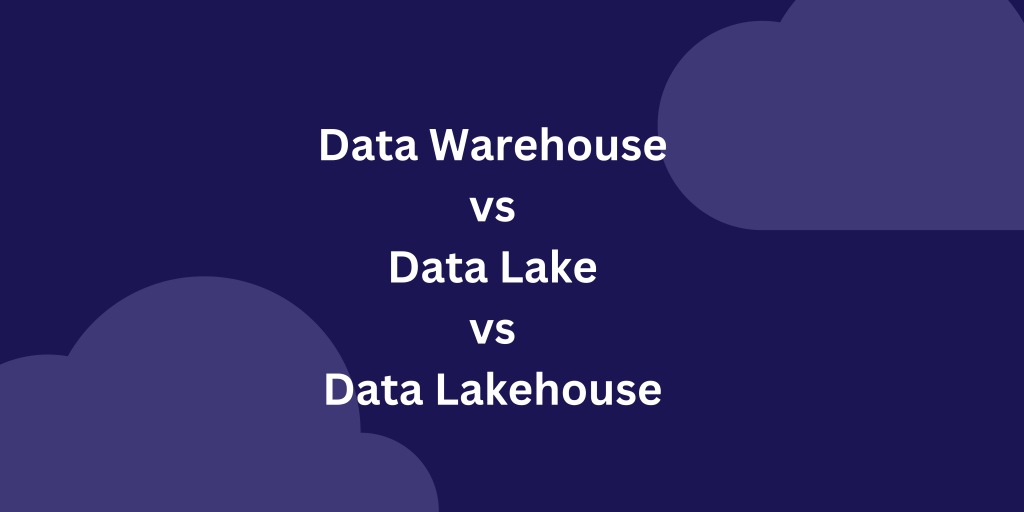
Data lake vs Data warehouse vs Data lake house
Confused between what is a data lake, a data warehouse and a data lakehouse? Read on to know the key differences and understand what fits best for your needs.
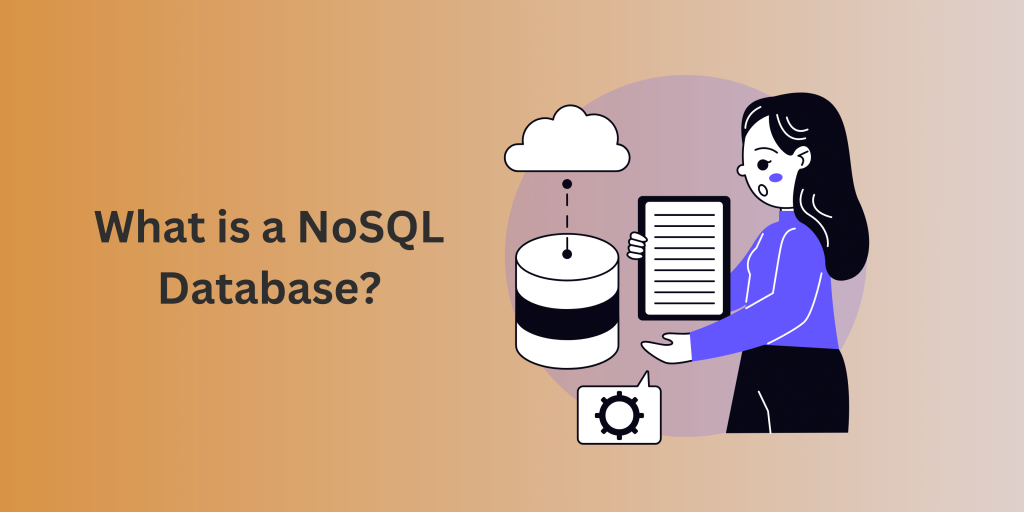
NoSQL Databases: What it is, How it works and how is it different from SQL.
In this blog, deep dive into the world of NoSQL databases. Learn about what they are, how they work and how are they different from SQL databases.
Make Data Work for You: 5 Must-Have Features in your Data Analytics Platform
You must have these 5 features in your data analytics platform if you want to make your data work harder but smarter and give you the insights that matter most!